如何在 ServBay 中啟用與設定 Xdebug 模組
ServBay 作為一套功能強大的本機 Web 開發環境,為 PHP 開發者預先整合了 Xdebug 除錯與分析工具。啟用 Xdebug 能大幅提升 PHP 專案的開發效率,讓您更方便地進行程式除錯、效能分析與程式碼涵蓋率檢測。本文詳細介紹如何在 ServBay 啟用和設定 Xdebug,並說明於主流整合式開發環境(IDE)中協同調試的方式。
Xdebug 模組簡介
Xdebug 是一個功能豐富、專為 PHP 程式除錯與分析打造的擴充模組。ServBay 預載 Xdebug,省去開發者自行編譯與安裝的繁瑣程序,使其啟用與設定變得極為容易。
Xdebug 主要功能
- 斷點除錯: 可於程式特定行設下斷點,程式運行至該點即暫停,開發者可檢查當前變數、調用堆疊等,逐行追蹤程式運作。
- 步進執行: 支援單步執行(Step Over)、進入(Step Into)、跳出(Step Out)函式,便於追蹤流程。
- 變數監控: 除錯期間可即時檢視區域/全域變數的值。
- 堆疊追蹤: 錯誤或例外時,提供詳細的呼叫堆疊,有助於快速定位問題。
- 效能分析 (Profiling): 產生程式執行效能報表,協助識別效能瓶頸。
- 程式碼涵蓋率 (Code Coverage): 量測測試涵蓋程式的比例,評估測試成效。
ServBay 內建 Xdebug 版本與埠號對應
ServBay 已為各 PHP 版本預裝相對應 Xdebug 模組。注意,每一 PHP 版本擁有獨立的 Xdebug 監聽埠號,且與其 PHP 版本相關聯,這對 IDE 中除錯器設定至關重要。
| PHP 版本 | 預裝 Xdebug 版本 | 預設 Xdebug 監聽埠號 |
|---|---|---|
| PHP 5.6 | Xdebug 2.5.5 | 39056 |
| PHP 7.0 | Xdebug 2.5.5 | 39070 |
| PHP 7.1 | Xdebug 2.5.5 | 39071 |
| PHP 7.2 | Xdebug 3.1.6 | 39072 |
| PHP 7.3 | Xdebug 3.1.6 | 39073 |
| PHP 7.4 | Xdebug 3.1.6 | 39074 |
| PHP 8.0 | Xdebug 3.3.1 | 39080 |
| PHP 8.1 | Xdebug 3.4.0 | 39081 |
| PHP 8.2 | Xdebug 3.4.0 | 39082 |
| PHP 8.3 | Xdebug 3.4.0 | 39083 |
| PHP 8.4 | Xdebug 3.4.0 | 39084 |
| PHP 8.5 | Xdebug 3.4.0 | 39085 |
埠號規則
Xdebug 的預設監聽埠號規則為 39000 + PHP 次版本號。例如 PHP 8.3 的埠號是 39000 + 83 = 39083,PHP 7.4 則為 39000 + 74 = 39074。掌握此規律有助您迅速得知不同版本 PHP 的對應 Xdebug 埠號。
如何啟用 Xdebug 模組
於 ServBay 啟用 Xdebug 模組非常便利,推薦使用 ServBay 圖形用戶介面(GUI)操作,亦可選擇手動修改設定檔。
透過 ServBay GUI 啟用 Xdebug
這是最簡單快速的方法:
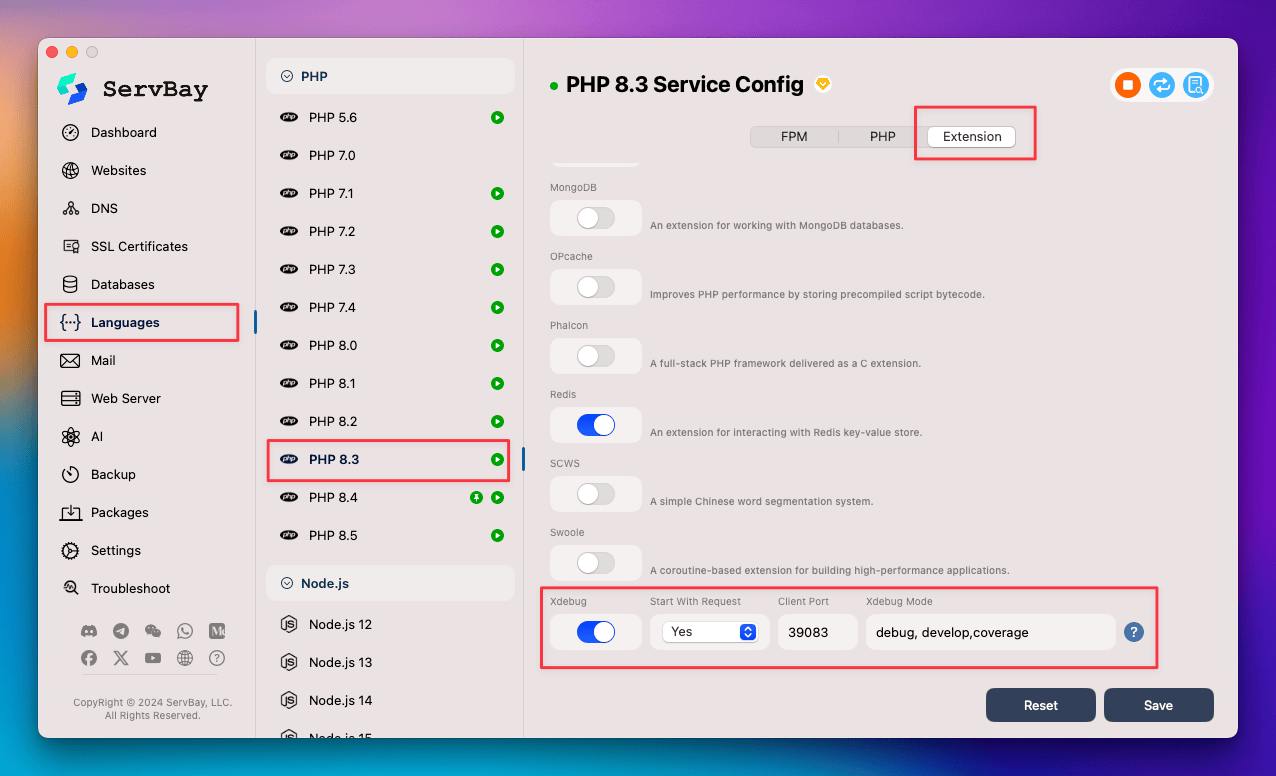
- 開啟 ServBay 應用程式介面。
- 在左側導覽列選擇
語言(Languages)。 - 展開
PHP區段,找到想啟用 Xdebug 的 PHP 版本,如PHP 8.3。 - 點擊該版本右方的
擴充按鈕。 - 在彈出之擴充清單中尋找
Xdebug模組。 - 點選
Xdebug模組左邊的開關,切換至開啟狀態。 - 依需求調整相關參數。
- 點選介面底部的
儲存按鈕。 - ServBay 會自動重啟對應 PHP 行程並載入模組。
 圖示:於擴充功能中啟用 Xdebug
驗證 Xdebug 模組是否成功載入
最可靠的方式為透過 phpinfo() 檢視 PHP 配置資訊。
- 在 ServBay 網站根目錄(預設
/Applications/ServBay/www)下建立一個簡單 PHP 檔案,如phpinfo.php。 - 於
phpinfo.php新增如下內容:php<?php phpinfo(); ?> - 使用瀏覽器訪問此檔案,例如
https://servbay.demo/phpinfo.php(請將servbay.demo替換為您於 ServBay 裡設定的網站網域)。 - 於
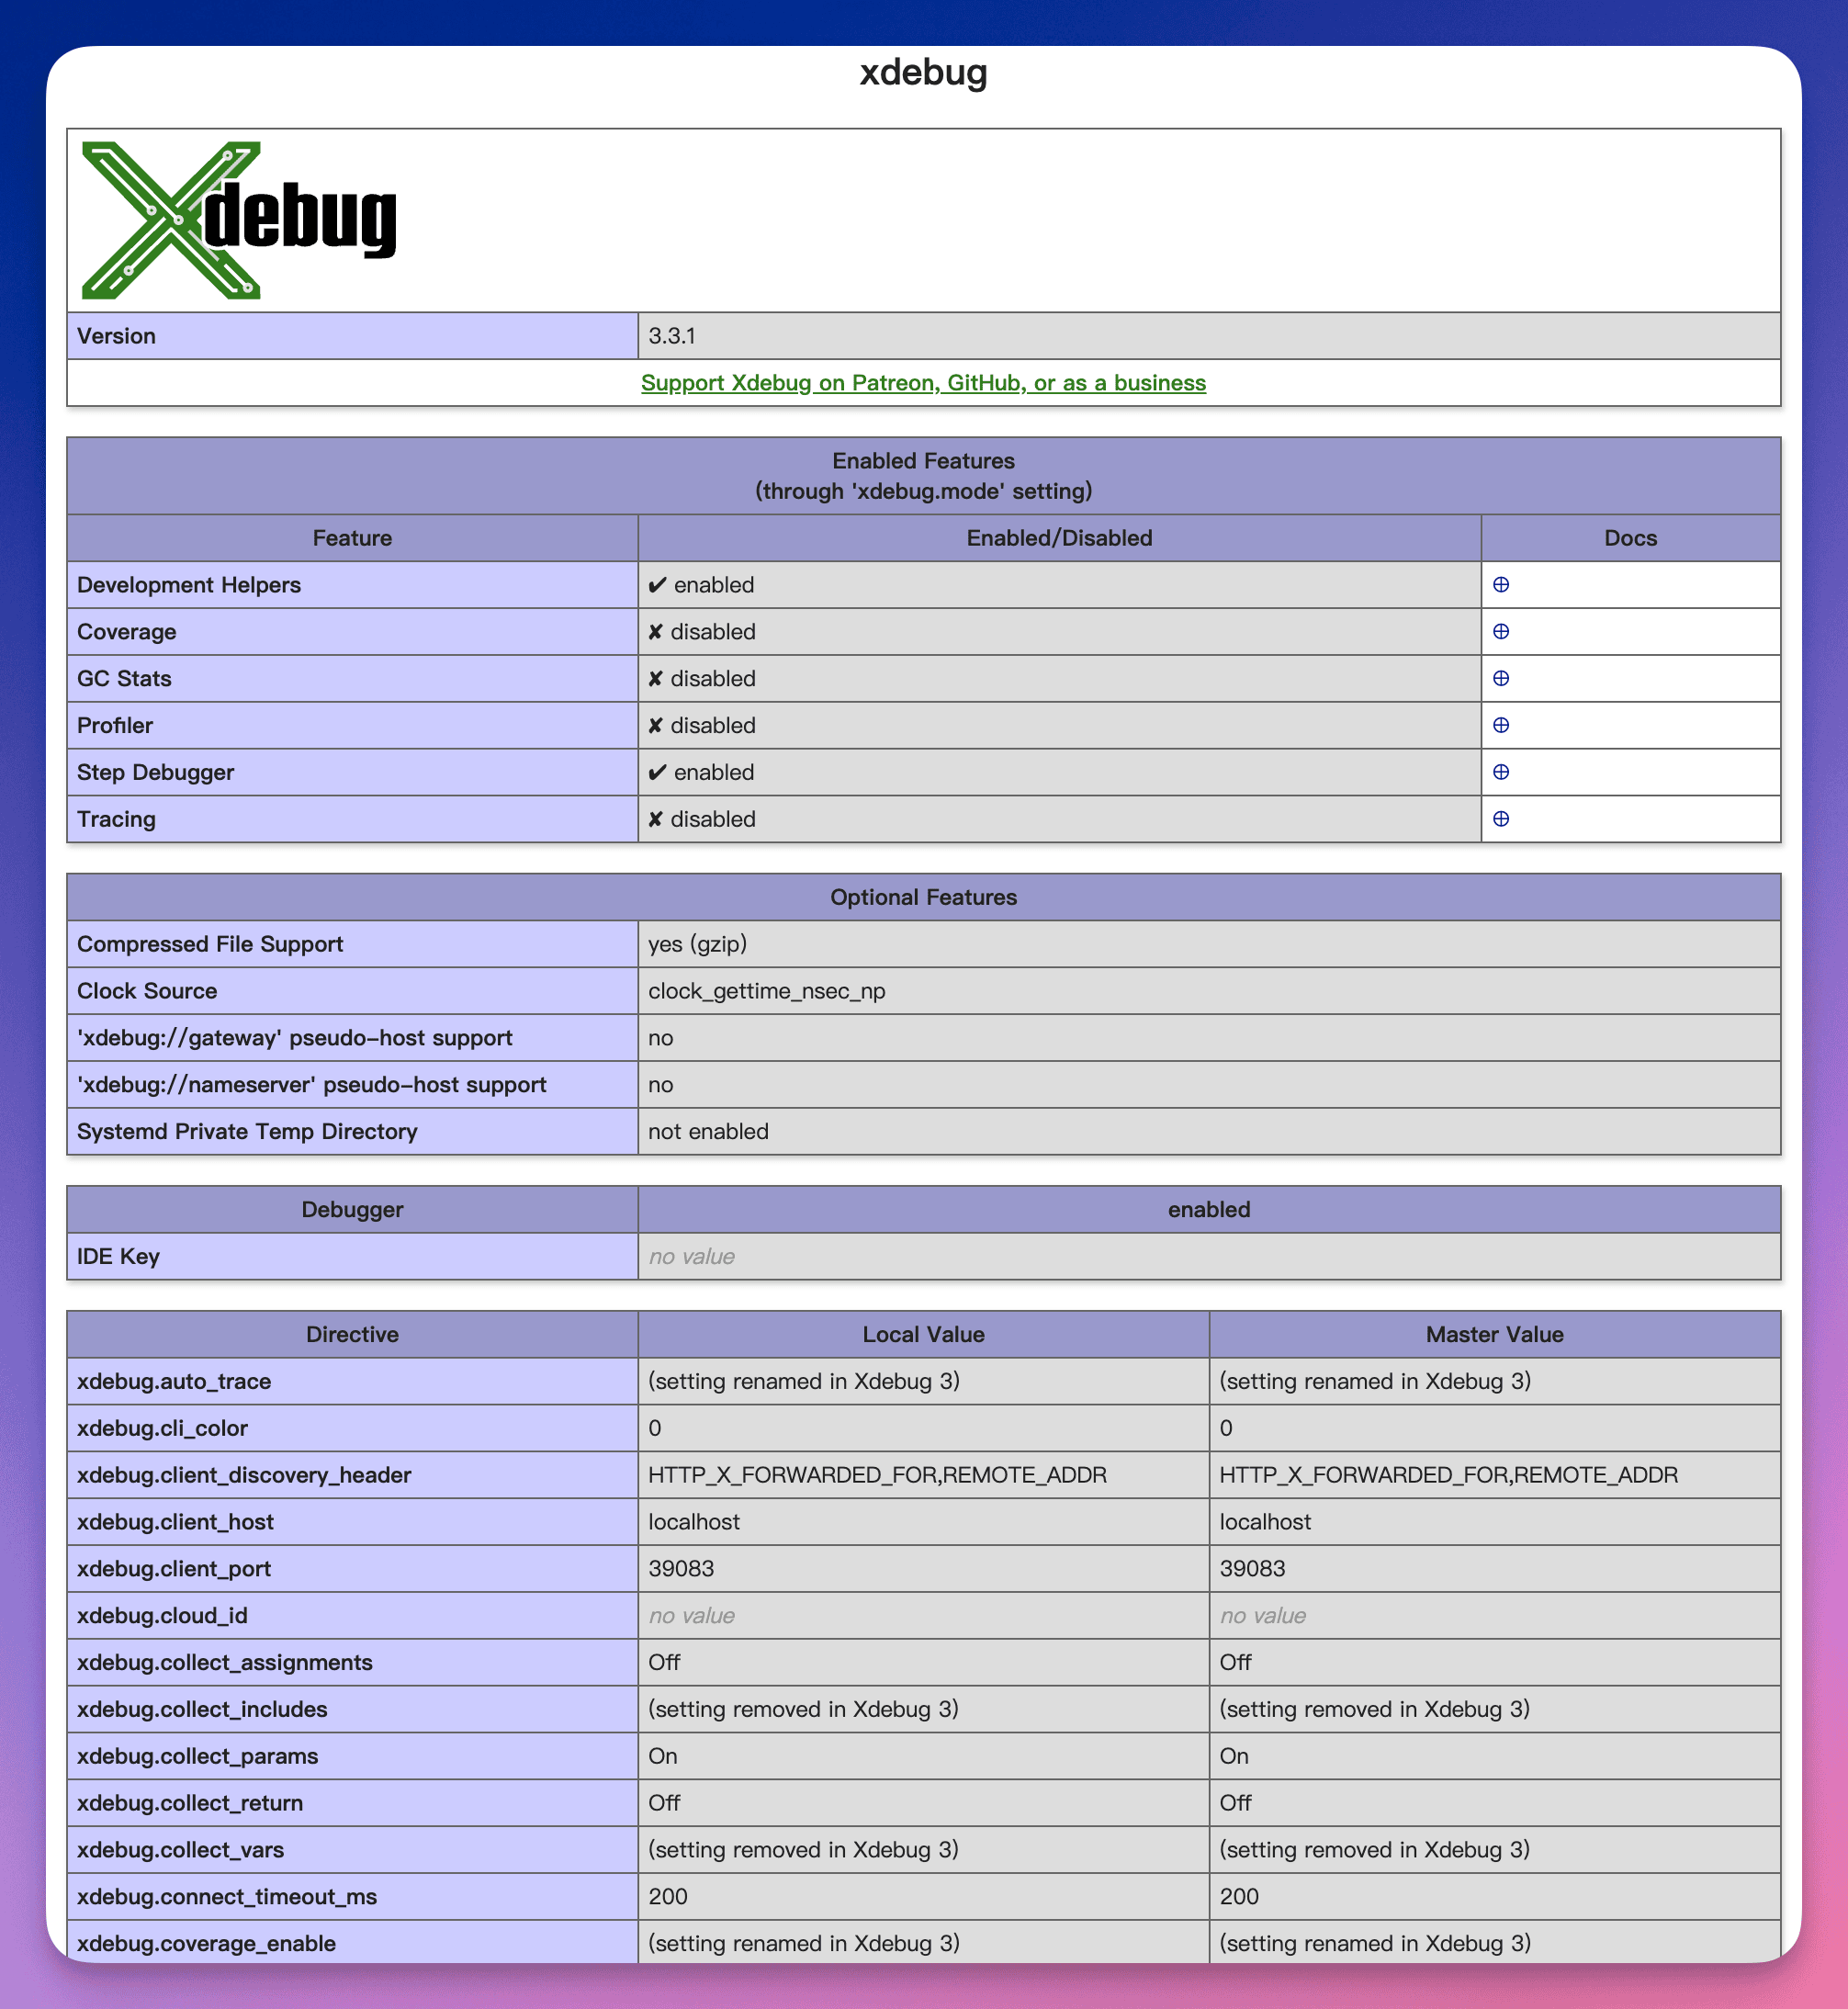
phpinfo頁面搜尋 "Xdebug"。若已成功載入,會看到獨立 "Xdebug" 配置區塊,內含版本與參數資訊。
 圖示:於 phpinfo 輸出中查詢 Xdebug 資訊
於 IDE 設定 Xdebug 進行除錯
僅啟用 Xdebug 還不夠,若要於 IDE 用斷點執行,要一併設定好 PHP 直譯器、除錯端口及伺服器路徑對應。下例分別以 PHPStorm 與 Visual Studio Code (VS Code) 示範。
於 PHPStorm 設定 Xdebug
PHPStorm 對 Xdebug 支援度極高。
開啟 PHPStorm 設定: 啟動 PHPStorm,於選單
File->Settings(Windows/Linux) 或PHPStorm->Preferences(macOS) 進入設定視窗。設定 PHP CLI 直譯器:
- 移至
Languages & Frameworks->PHP。 - 於
CLI Interpreter點擊右側的...按鈕。 - 在彈出視窗點
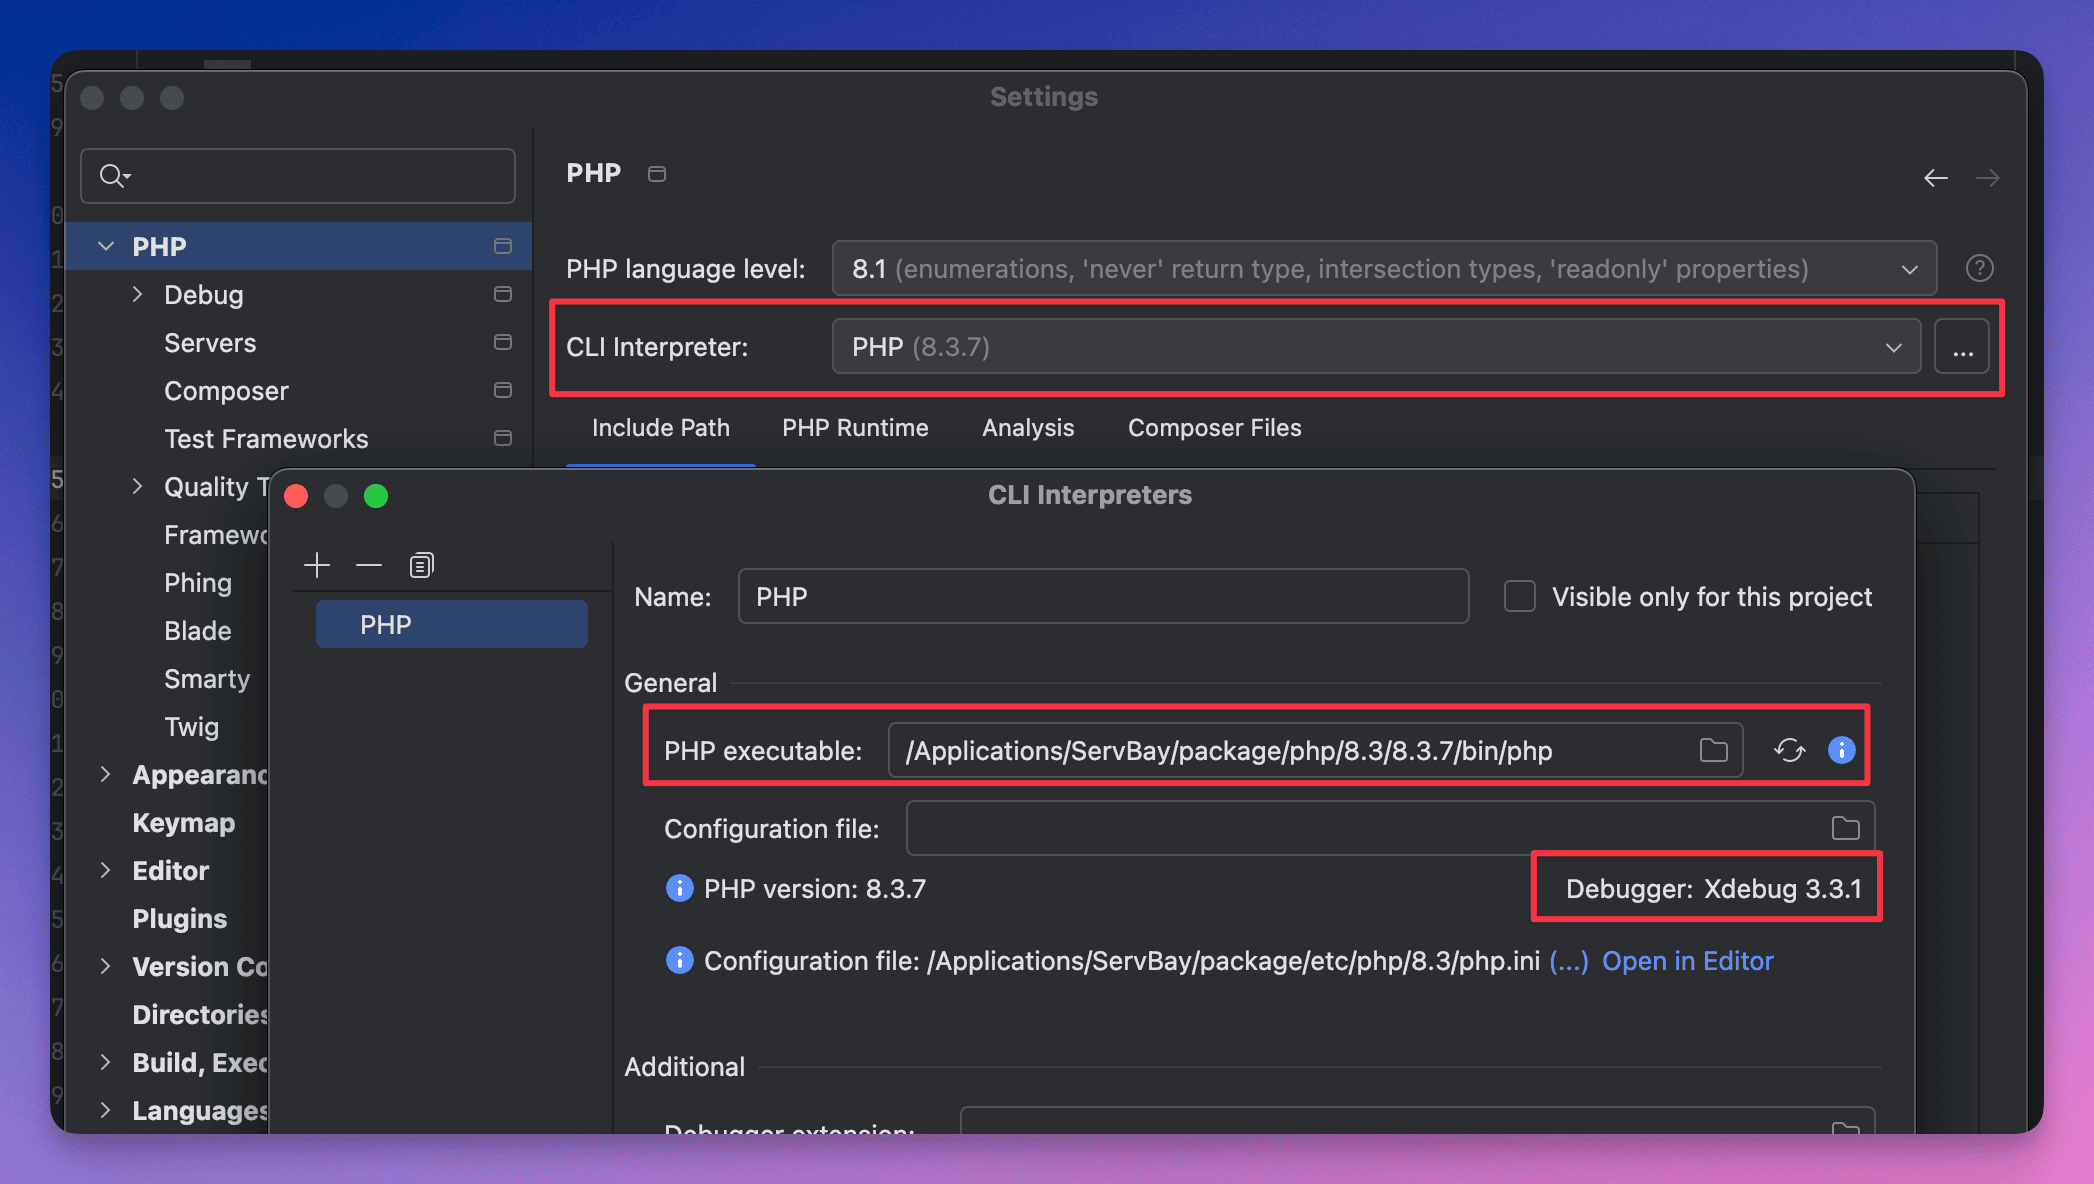
+新增本地直譯器。 - 指定 ServBay 對應版本 PHP CLI 執行路徑,例如
/Applications/ServBay/package/php/8.3/8.3.7/bin/php(版本號隨 ServBay 升級不同,請以您的安裝路徑為準)。 - PHPStorm 會自動偵測版本號與擴充資訊,包括 Xdebug。
- 點選
OK儲存設定。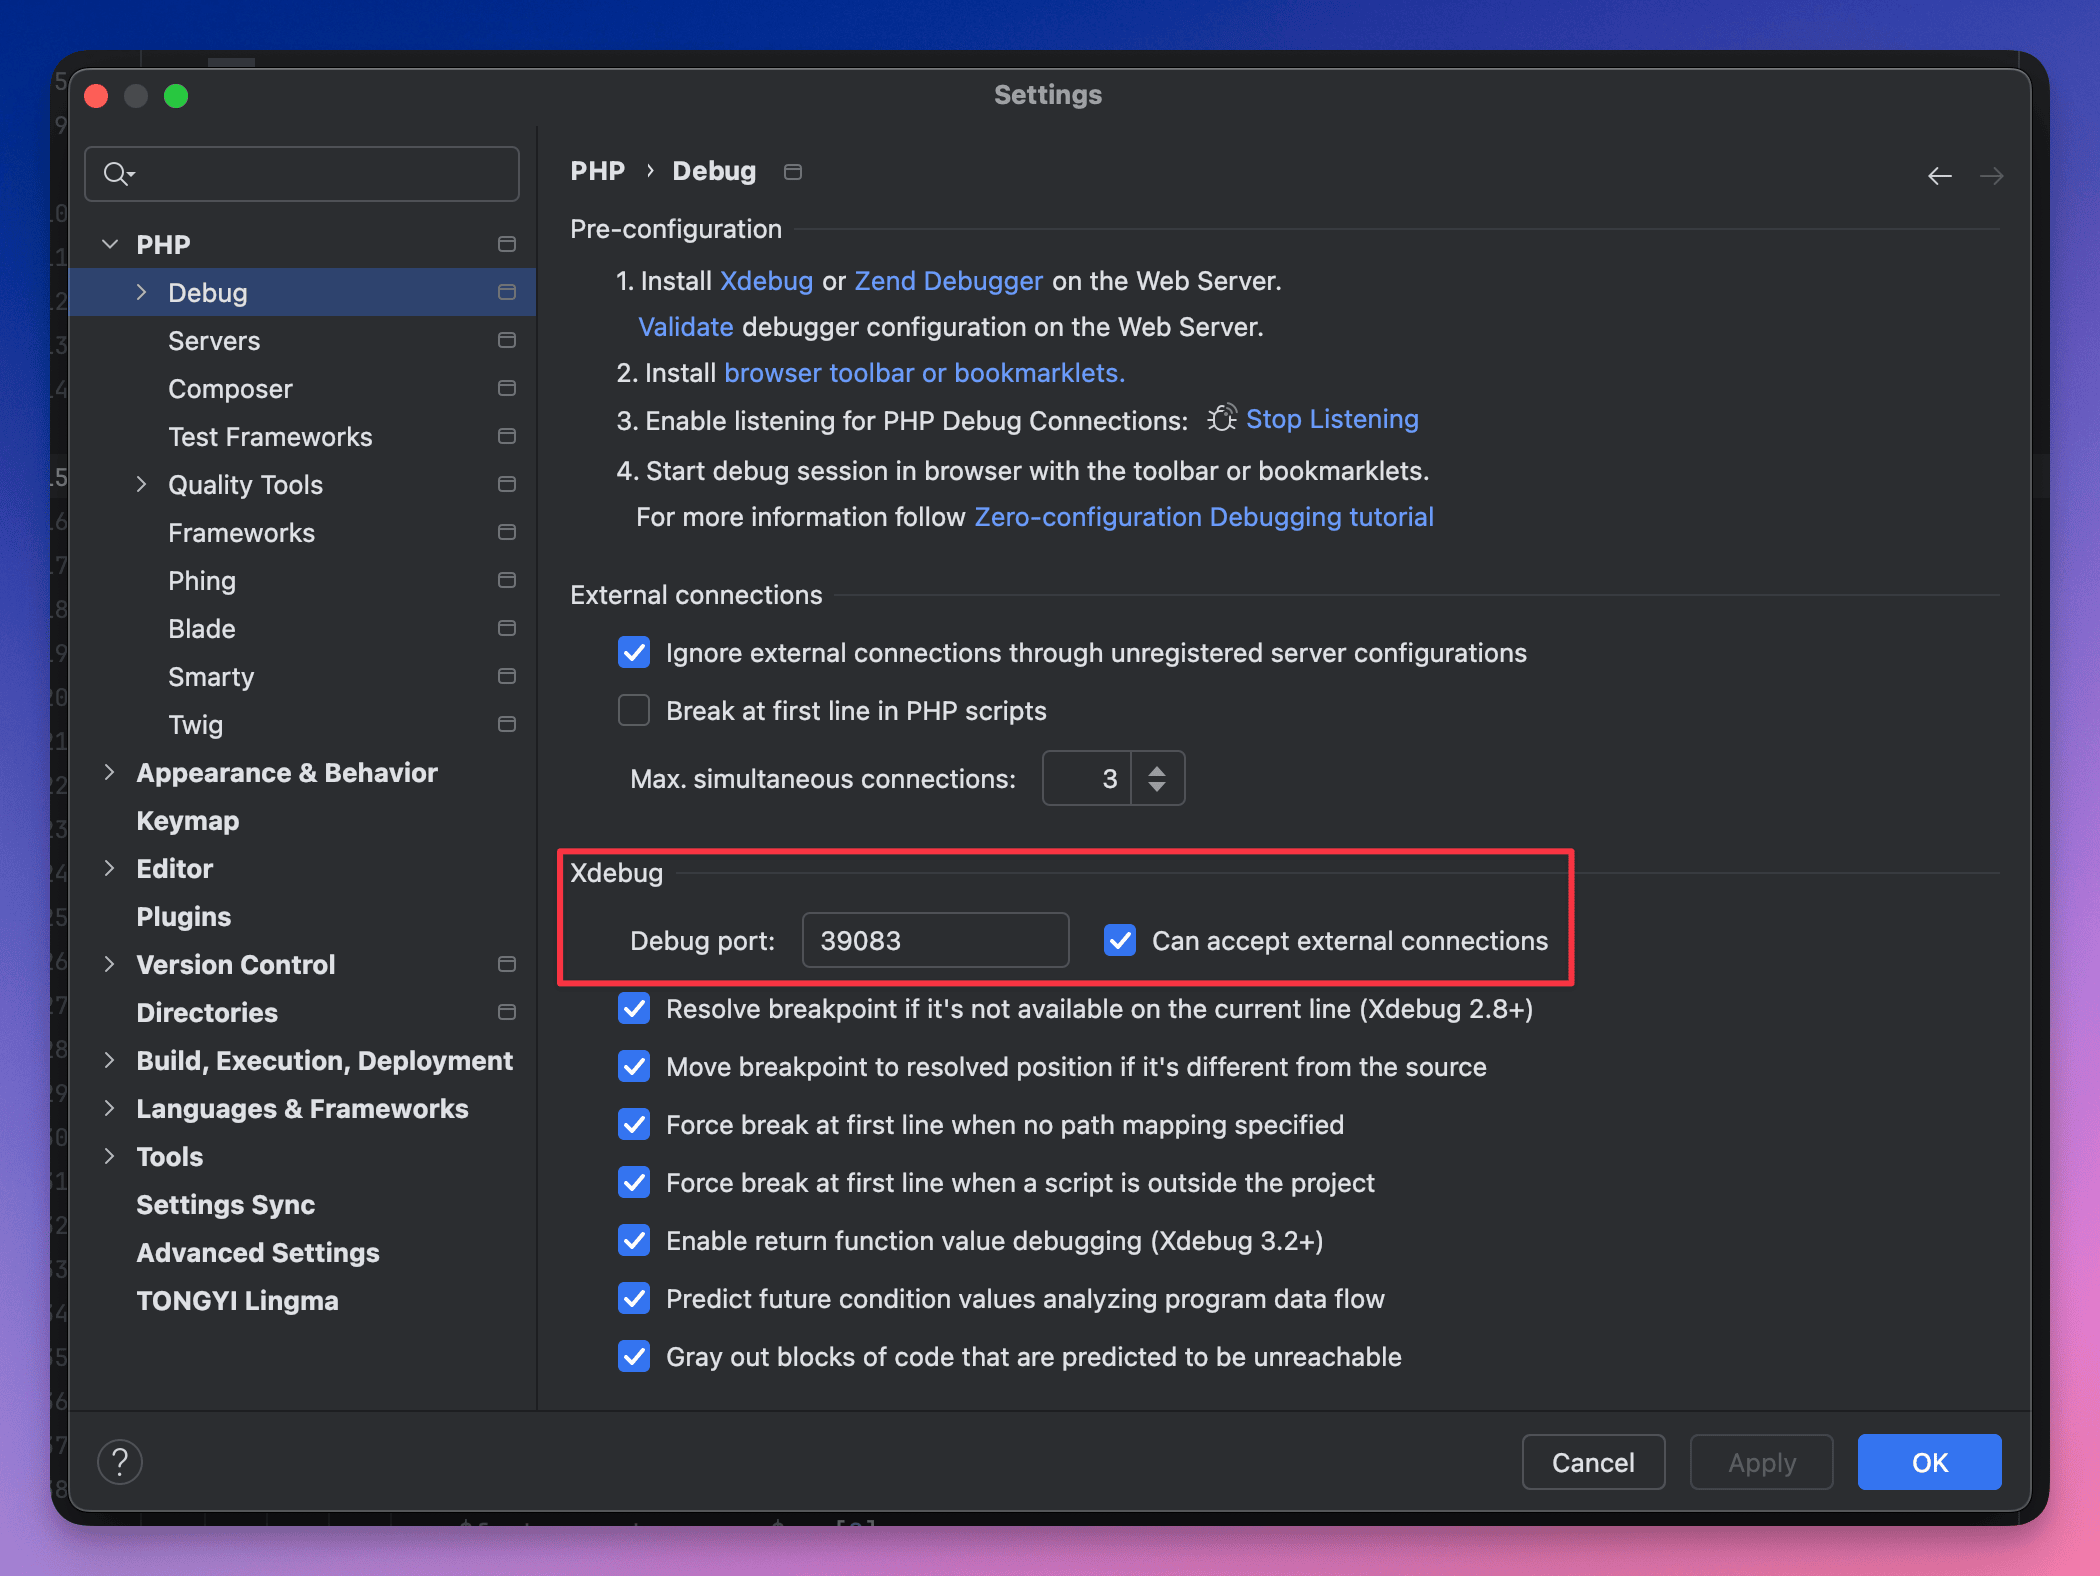 圖示:於 PHPStorm 設定 ServBay 的 PHP CLI 直譯器
- 移至
設定 Xdebug 除錯參數:
- 移轉至
Languages & Frameworks->PHP->Debug。 - 於
Xdebug部分,填入Debug Port,即您在 ServBay 啟用之 PHP 版本對應的 Xdebug 監聽埠(例如 PHP 8.3 則設39083)。請確保該埠與xdebug.client_port一致。 - 勾選
Can accept external connections。 - 按
Apply再OK存檔。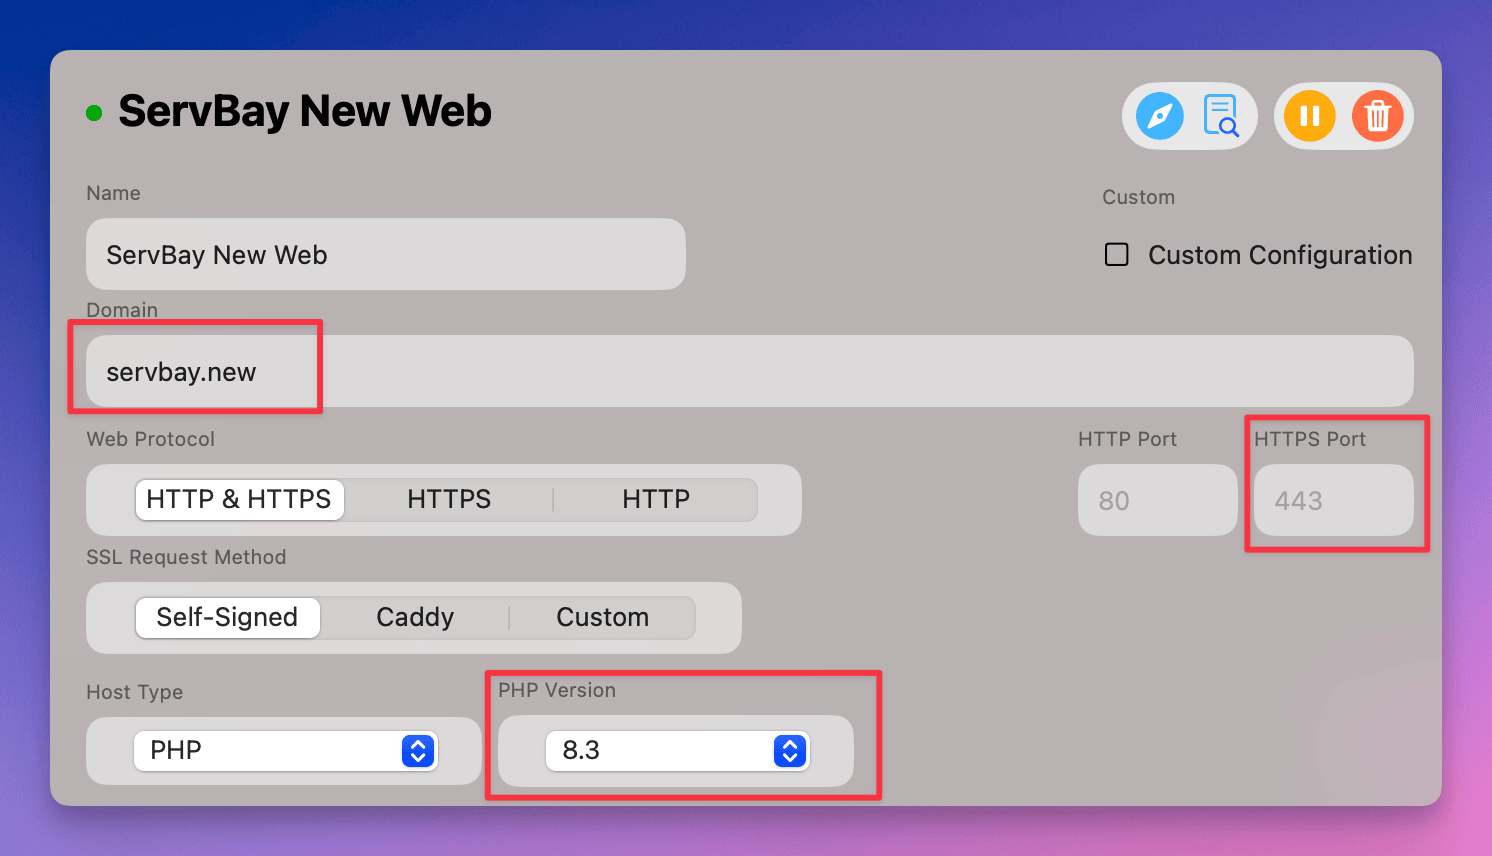 圖示:於 PHPStorm 設定 Xdebug 監聽埠號
- 移轉至
設定 PHP 網站伺服器映射:
- 進到
Languages & Frameworks->PHP->Servers。 - 右側點
+新增一組伺服器設定。 - 輸入伺服器名稱(例:
ServBay Localhost)。 Host填您於 ServBay 設定的網站網域(例servbay.demo)。Port為該網站所用埠號,預設為443(HTTPS) 或80(HTTP)。Debugger選擇Xdebug。- 勾選下方
Use path mappings。 - 設定本機專案路徑 (
Absolute path to local source) 與伺服器路徑 (Absolute path on the server) 的對應。通常,若您的專案在/Applications/ServBay/www/myproject,且以https://servbay.demo/存取,則本機路徑/Applications/ServBay/www/myproject對應至伺服器/。如以https://myproject.servbay.demo/存取且專案根目錄同為/Applications/ServBay/www/myproject,則路徑同理。正確路徑對應是 Xdebug 成功運作關鍵。 - 點擊
OK儲存設定。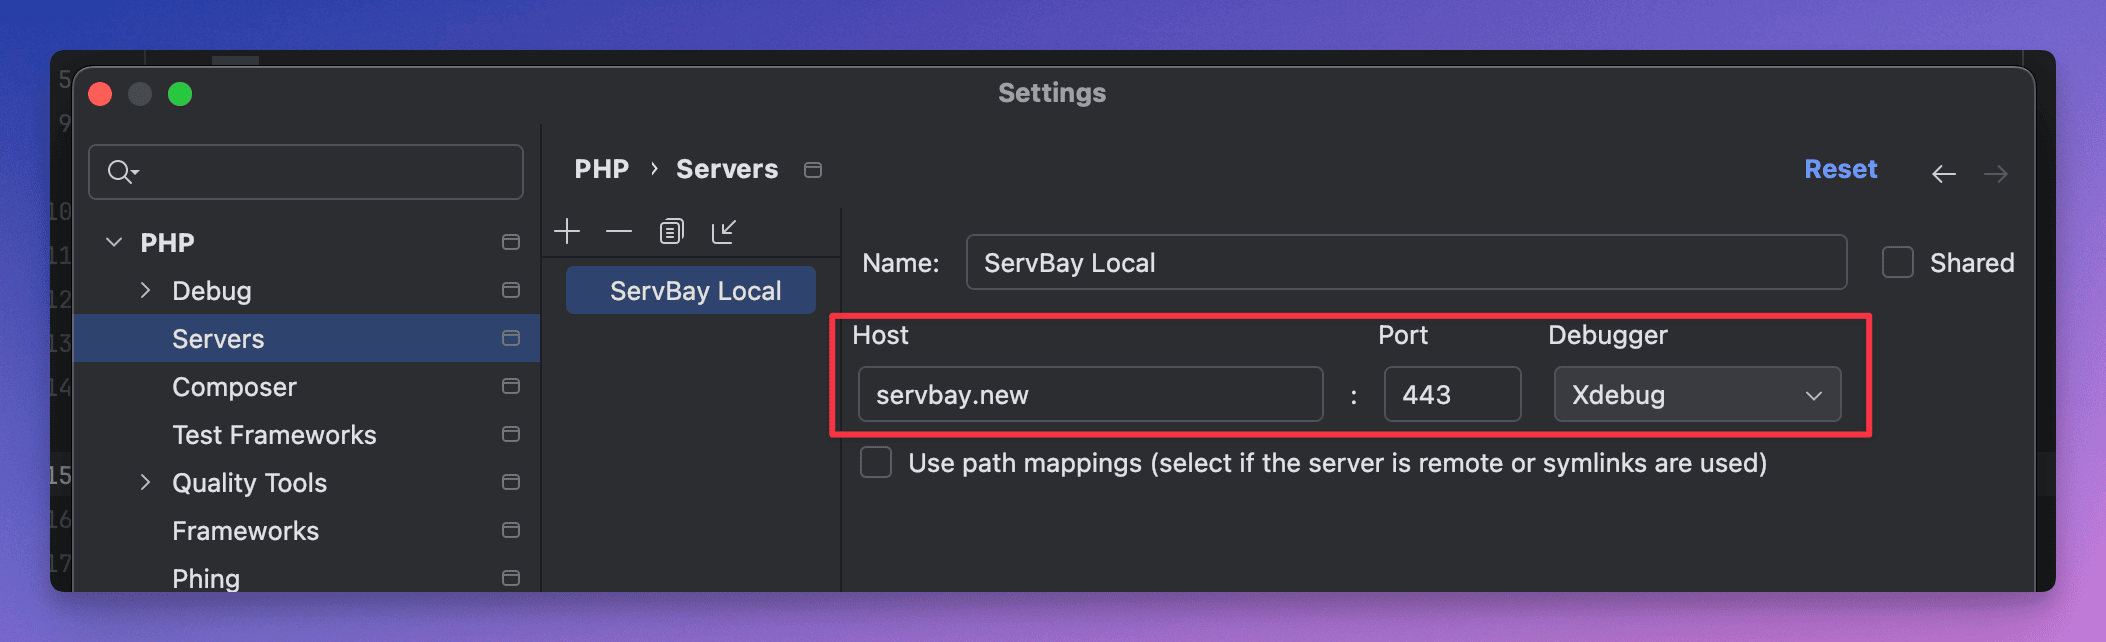
 圖示:於 PHPStorm 設定伺服器與路徑映射
- 進到
啟動除錯會話:
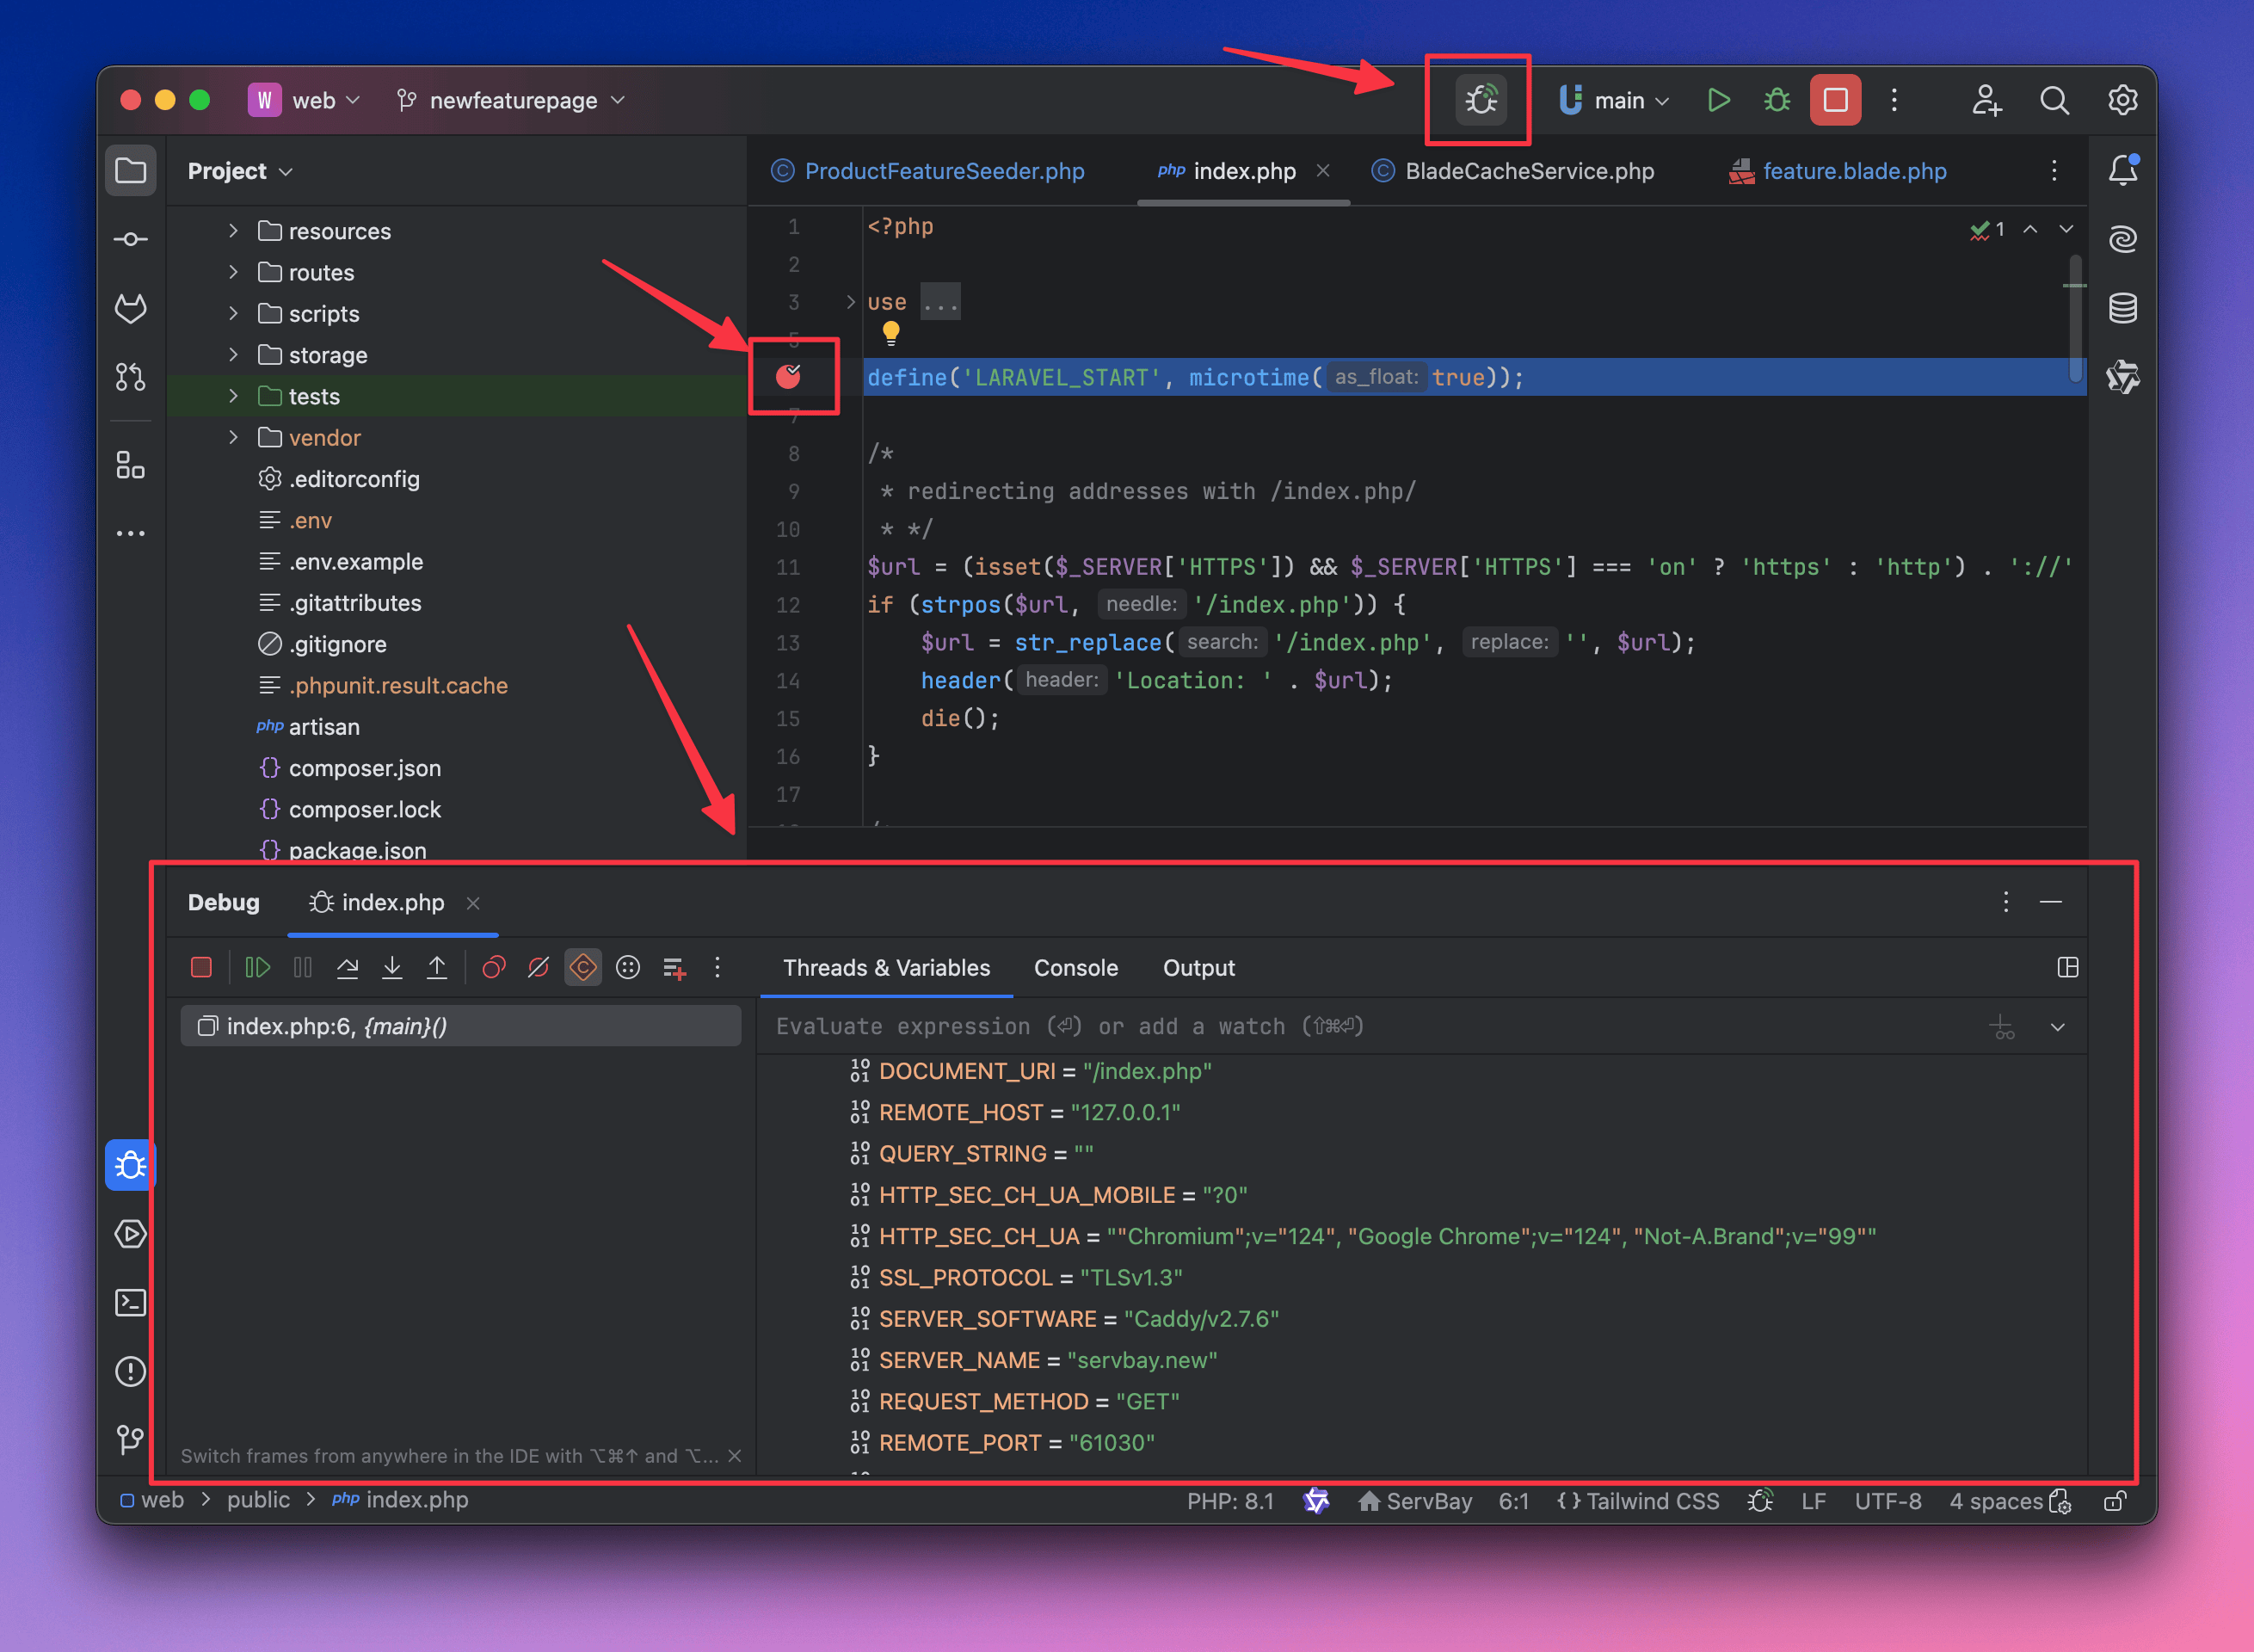
- 於 PHPStorm 開啟想除錯的 PHP 專案檔。
- 在行號左側空白點擊,設下斷點(紅色圓點)。
- 點工具列的
Start Listening for PHP Debug Connections(蟲子圖示),按鈕轉為綠色表示已開始監聽。 - 於瀏覽器存取您的 PHP 網站(如
https://servbay.demo/index.php)。 - 若設定無誤,Xdebug 將自動連線至 PHPStorm 並在斷點處暫停,此時即可於 PHPStorm 進行除錯。
 圖示:於 PHPStorm 啟動 Xdebug 監聽
於 Visual Studio Code (VS Code) 設定 Xdebug
VS Code 為另一熱門編輯器,能透過擴充支援 Xdebug 除錯。
安裝 PHP Debug 擴充:
- 啟動 VS Code。
- 切換至擴充功能頁 (
Ctrl+Shift+X或Cmd+Shift+X)。 - 搜尋 "PHP Debug" 並安裝 Felix Becker 製作的擴充。
設定
launch.json:- 開啟您的 PHP 專案資料夾。
- 切換至執行與除錯頁 (
Ctrl+Shift+D或Cmd+Shift+D)。 - 點頂部工具列的齒輪並選擇 "PHP",會在
.vscode資料夾建立launch.json。 - 編輯
launch.json,內有 "Listen for Xdebug" 配置,請確認其中的port與 ServBay 啟用 PHP 版本的監聽埠一致(如 PHP 8.3 用39083)。 - 設置路徑映射 (pathMappings): 這是 VS Code 除錯關鍵。在
launch.json加入或修正pathMappings,將 ServBay 伺服器專案路徑對應到本機檔案系統。json請依您的專案目錄結構與 ServBay 網站設定適當調整{ "version": "0.2.0", "configurations": [ { "name": "Listen for Xdebug", "type": "php", "request": "launch", "port": 39083, // 請依 PHP 版本調整埠號 "pathMappings": { // 將 ServBay 網站根目錄的專案路徑對應至本機專案目錄 // 若專案於 /Applications/ServBay/www/myproject // 並以 https://servbay.demo/ 存取,則 '/' 應對應本機根目錄 "/": "${workspaceRoot}" // 如於 /Applications/ServBay/www/myproject // 以 https://myproject.servbay.demo/ (子網域) 存取時亦同 // "/": "${workspaceRoot}" // 也適用 } }, { "name": "Launch currently open script", "type": "php", "request": "launch", "program": "${file}", "cwd": "${fileDirname}", "port": 39083 // 請依 PHP 版本調整埠號 } ] }pathMappings。${workspaceRoot}通常指您於 VS Code 開啟的專案根目錄。
啟動除錯會話:
- 於 VS Code 開啟 PHP 專案檔。
- 在行號左點選以建立斷點(紅色圓點)。
- 切至執行與除錯頁 (
Ctrl+Shift+D或Cmd+Shift+D)。 - 於頂部下拉選單選取剛設的 "Listen for Xdebug" 配置。
- 點擊綠色啟動除錯按鈕,VS Code 狀態列會變橙色,表示正在監聽。
- 於瀏覽器存取您的 PHP 網站,若配置正確即會於斷點處停下。
常見問題 (FAQ)
Q: Xdebug 模組未在
phpinfo()頁面顯示?- A: 請確認您已於 ServBay GUI 或手動於
xdebug.ini啟用 Xdebug。 - 請確認對應 PHP 服務已重新啟動。
- 檢查
xdebug.ini路徑及zend_extension = xdebug.so是否已取消註解。 - 請查看 ServBay 日誌(
/Applications/ServBay/logs/php/<version>/error.log)有無 Xdebug 載入失敗訊息。
- A: 請確認您已於 ServBay GUI 或手動於
Q: IDE 斷點沒觸發?
- A: 請先確保您的 IDE 正在偵聽 Xdebug 連線(PHPStorm 蟲子圖示變綠、VS Code 狀態列變橙)。
- IDE 設定的 Xdebug 監聽埠是否與 ServBay 及
xdebug.client_port保持一致。 - IDE 的**路徑對應(Path Mapping)**是否設正確,需保證伺服器與本機檔案能正確對應。這是最常見的配置問題。
- 檢查防火牆設定,勿阻擋 IDE 監聽的 Xdebug 埠(預設
390xx系列)。 - 若
xdebug.ini設置xdebug.start_with_request=trigger,需確認瀏覽器或請求帶有觸發參數(如安裝 Xdebug Helper 擴充,或 URL 帶?XDEBUG_TRIGGER=1)。
Q: Xdebug 連線過一段時間會中斷?
- A: 檢查
xdebug.ini的xdebug.remote_autostart或xdebug.start_with_request,若設yes可能導致每次請求都嘗試啟動調試。建議用trigger模式。 - 檢查 IDE 除錯設定,某些 IDE 可能有連線逾時限制。
- A: 檢查
結論
ServBay 憑藉預載與極簡配置流程,極大降低 PHP 開發者在本機啟用與使用 Xdebug 的技術門檻。不論透過圖形介面或手動調整設定檔,您都能快速於 ServBay 各版本 PHP 環境下啟動 Xdebug。結合 PHPStorm、VS Code 等 IDE 強大除錯功能,您可高效進行 PHP 程式碼除錯、效能調優與品質監管,顯著提升開發效率。熟悉 ServBay 與 Xdebug 的整合運用,將成為您最佳的本機 PHP 開發利器。