
Cách bật và cấu hình module Xdebug trong ServBay
ServBay là một môi trường phát triển Web địa phương mạnh mẽ, đã tích hợp sẵn công cụ phân tích và gỡ lỗi Xdebug dành cho lập trình viên PHP. Việc bật Xdebug sẽ giúp cải thiện đáng kể hiệu suất phát triển PHP, giúp bạn debug, phân tích hiệu năng và kiểm tra độ bao phủ mã một cách thuận tiện hơn. Bài viết này sẽ hướng dẫn chi tiết cách kích hoạt và cấu hình Xdebug trong ServBay, cũng như hướng dẫn tích hợp với các môi trường phát triển tích hợp tiên tiến (IDE) phổ biến.
Tổng quan về module Xdebug
Xdebug là một extension PHP đa năng được thiết kế riêng cho việc debug và phân tích mã PHP. Với việc Xdebug đã được tích hợp sẵn trong ServBay, bạn không còn phải tự mình biên dịch hay cài đặt, nên việc bật và cấu hình trở nên cực kỳ đơn giản.
Các chức năng chính của Xdebug
- Gỡ lỗi bằng điểm dừng (Breakpoint): Cho phép bạn đặt điểm dừng tại một dòng bất kỳ, khi chương trình chạy đến sẽ tạm dừng để kiểm tra biến, call stack... và thực thi từng bước.
- Debug tuần tự: Hỗ trợ thực thi từng bước mã (Step Over), vào trong hàm (Step Into), nhảy ra khỏi hàm (Step Out), giúp theo dõi luồng thực thi dễ dàng.
- Theo dõi biến: Xem giá trị các biến cục bộ và toàn cục theo thời gian thực khi debug.
- Theo dõi call stack: Khi gặp lỗi hoặc exception, Xdebug cung cấp thông tin call stack chi tiết giúp xác định nguồn gốc vấn đề nhanh chóng.
- Phân tích hiệu năng (Profiling): Sinh báo cáo hiệu suất thực thi, hỗ trợ xác định điểm nghẽn hiệu năng.
- Đo lường độ bao phủ mã (Code Coverage): Đo tỉ lệ mã được bao phủ bởi bài test, đánh giá hiệu quả của kiểm thử.
Phiên bản Xdebug tích hợp và ánh xạ cổng trong ServBay
ServBay cài sẵn các phiên bản Xdebug tương ứng cho từng phiên bản PHP. Lưu ý, mỗi phiên bản PHP sẽ có cổng lắng nghe (listening port) riêng biệt dành cho Xdebug, thường được liên kết với số phiên bản PHP - điều này rất quan trọng khi cấu hình trình gỡ lỗi trên IDE.
| PHP phiên bản | Xdebug tích hợp sẵn | Cổng lắng nghe mặc định Xdebug |
|---|---|---|
| PHP 5.6 | Xdebug 2.5.5 | 39056 |
| PHP 7.0 | Xdebug 2.5.5 | 39070 |
| PHP 7.1 | Xdebug 2.5.5 | 39071 |
| PHP 7.2 | Xdebug 3.1.6 | 39072 |
| PHP 7.3 | Xdebug 3.1.6 | 39073 |
| PHP 7.4 | Xdebug 3.1.6 | 39074 |
| PHP 8.0 | Xdebug 3.3.1 | 39080 |
| PHP 8.1 | Xdebug 3.4.0 | 39081 |
| PHP 8.2 | Xdebug 3.4.0 | 39082 |
| PHP 8.3 | Xdebug 3.4.0 | 39083 |
| PHP 8.4 | Xdebug 3.4.0 | 39084 |
| PHP 8.5 | Xdebug 3.4.0 | 39085 |
Quy tắc cổng
Quy tắc chọn cổng lắng nghe mặc định của Xdebug là 39000 + số phụ của phiên bản PHP. Ví dụ: PHP 8.3 sẽ dùng cổng 39000 + 83 = 39083, PHP 7.4 sẽ dùng 39000 + 74 = 39074. Hiểu quy tắc này giúp bạn xác định nhanh số cổng Xdebug tương ứng với từng phiên bản PHP.
Cách kích hoạt Xdebug
Kích hoạt Xdebug trong ServBay cực kỳ đơn giản, chúng tôi khuyến nghị sử dụng giao diện trực quan (GUI) của ServBay. Bạn cũng có thể lựa chọn chỉnh sửa file cấu hình thủ công.
Bật Xdebug qua giao diện GUI của ServBay
Đây là cách dễ dàng và nhanh nhất.
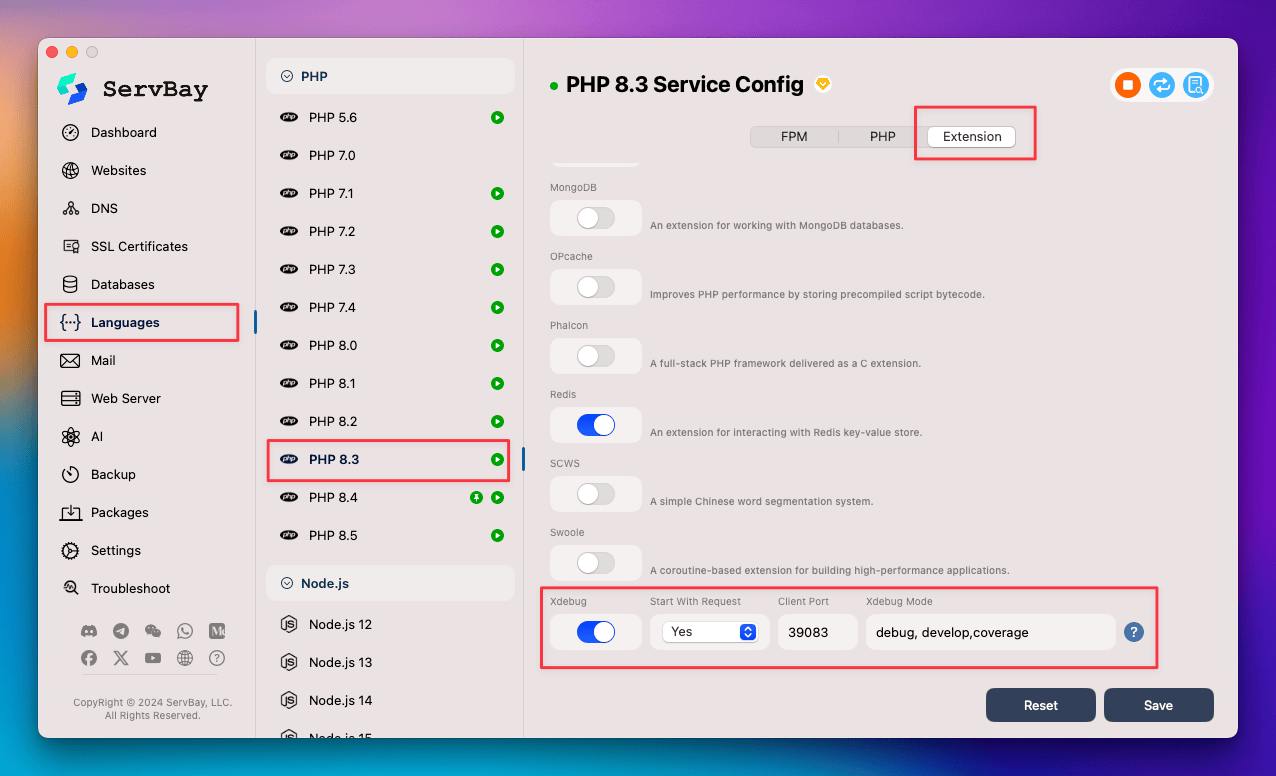
- Mở giao diện ứng dụng ServBay.
- Từ thanh điều hướng bên trái, chọn
Ngôn ngữ(Languages). - Mở rộng phần
PHPvà tìm tới phiên bản PHP bạn muốn bật Xdebug, ví dụPHP 8.3. - Nhấn nút
Extensionsbên phải phiên bản tương ứng. - Trong danh sách extension hiện ra, tìm đến module
Xdebug. - Nhấn công tắc bên trái module
Xdebugđể chuyển trạng thái từ Tắt sang Bật. - Chỉnh sửa tham số nếu cần thiết.
- Nhấn
Lưuở cuối giao diện. - ServBay sẽ tự động khởi động lại tiến trình PHP và nạp module Xdebug.
 Hình minh họa: Bật Xdebug trong phần Extensions
Kiểm tra Xdebug đã được tải thành công chưa
Cách kiểm tra chắc chắn nhất là dùng hàm phpinfo() để xem thông tin cấu hình PHP.
- Tạo một file PHP mới (ví dụ
phpinfo.php) tại thư mục gốc website ServBay (mặc định/Applications/ServBay/www). - Thêm nội dung sau vào file
phpinfo.php:php<?php phpinfo(); ?> - Truy cập file này trên trình duyệt, ví dụ
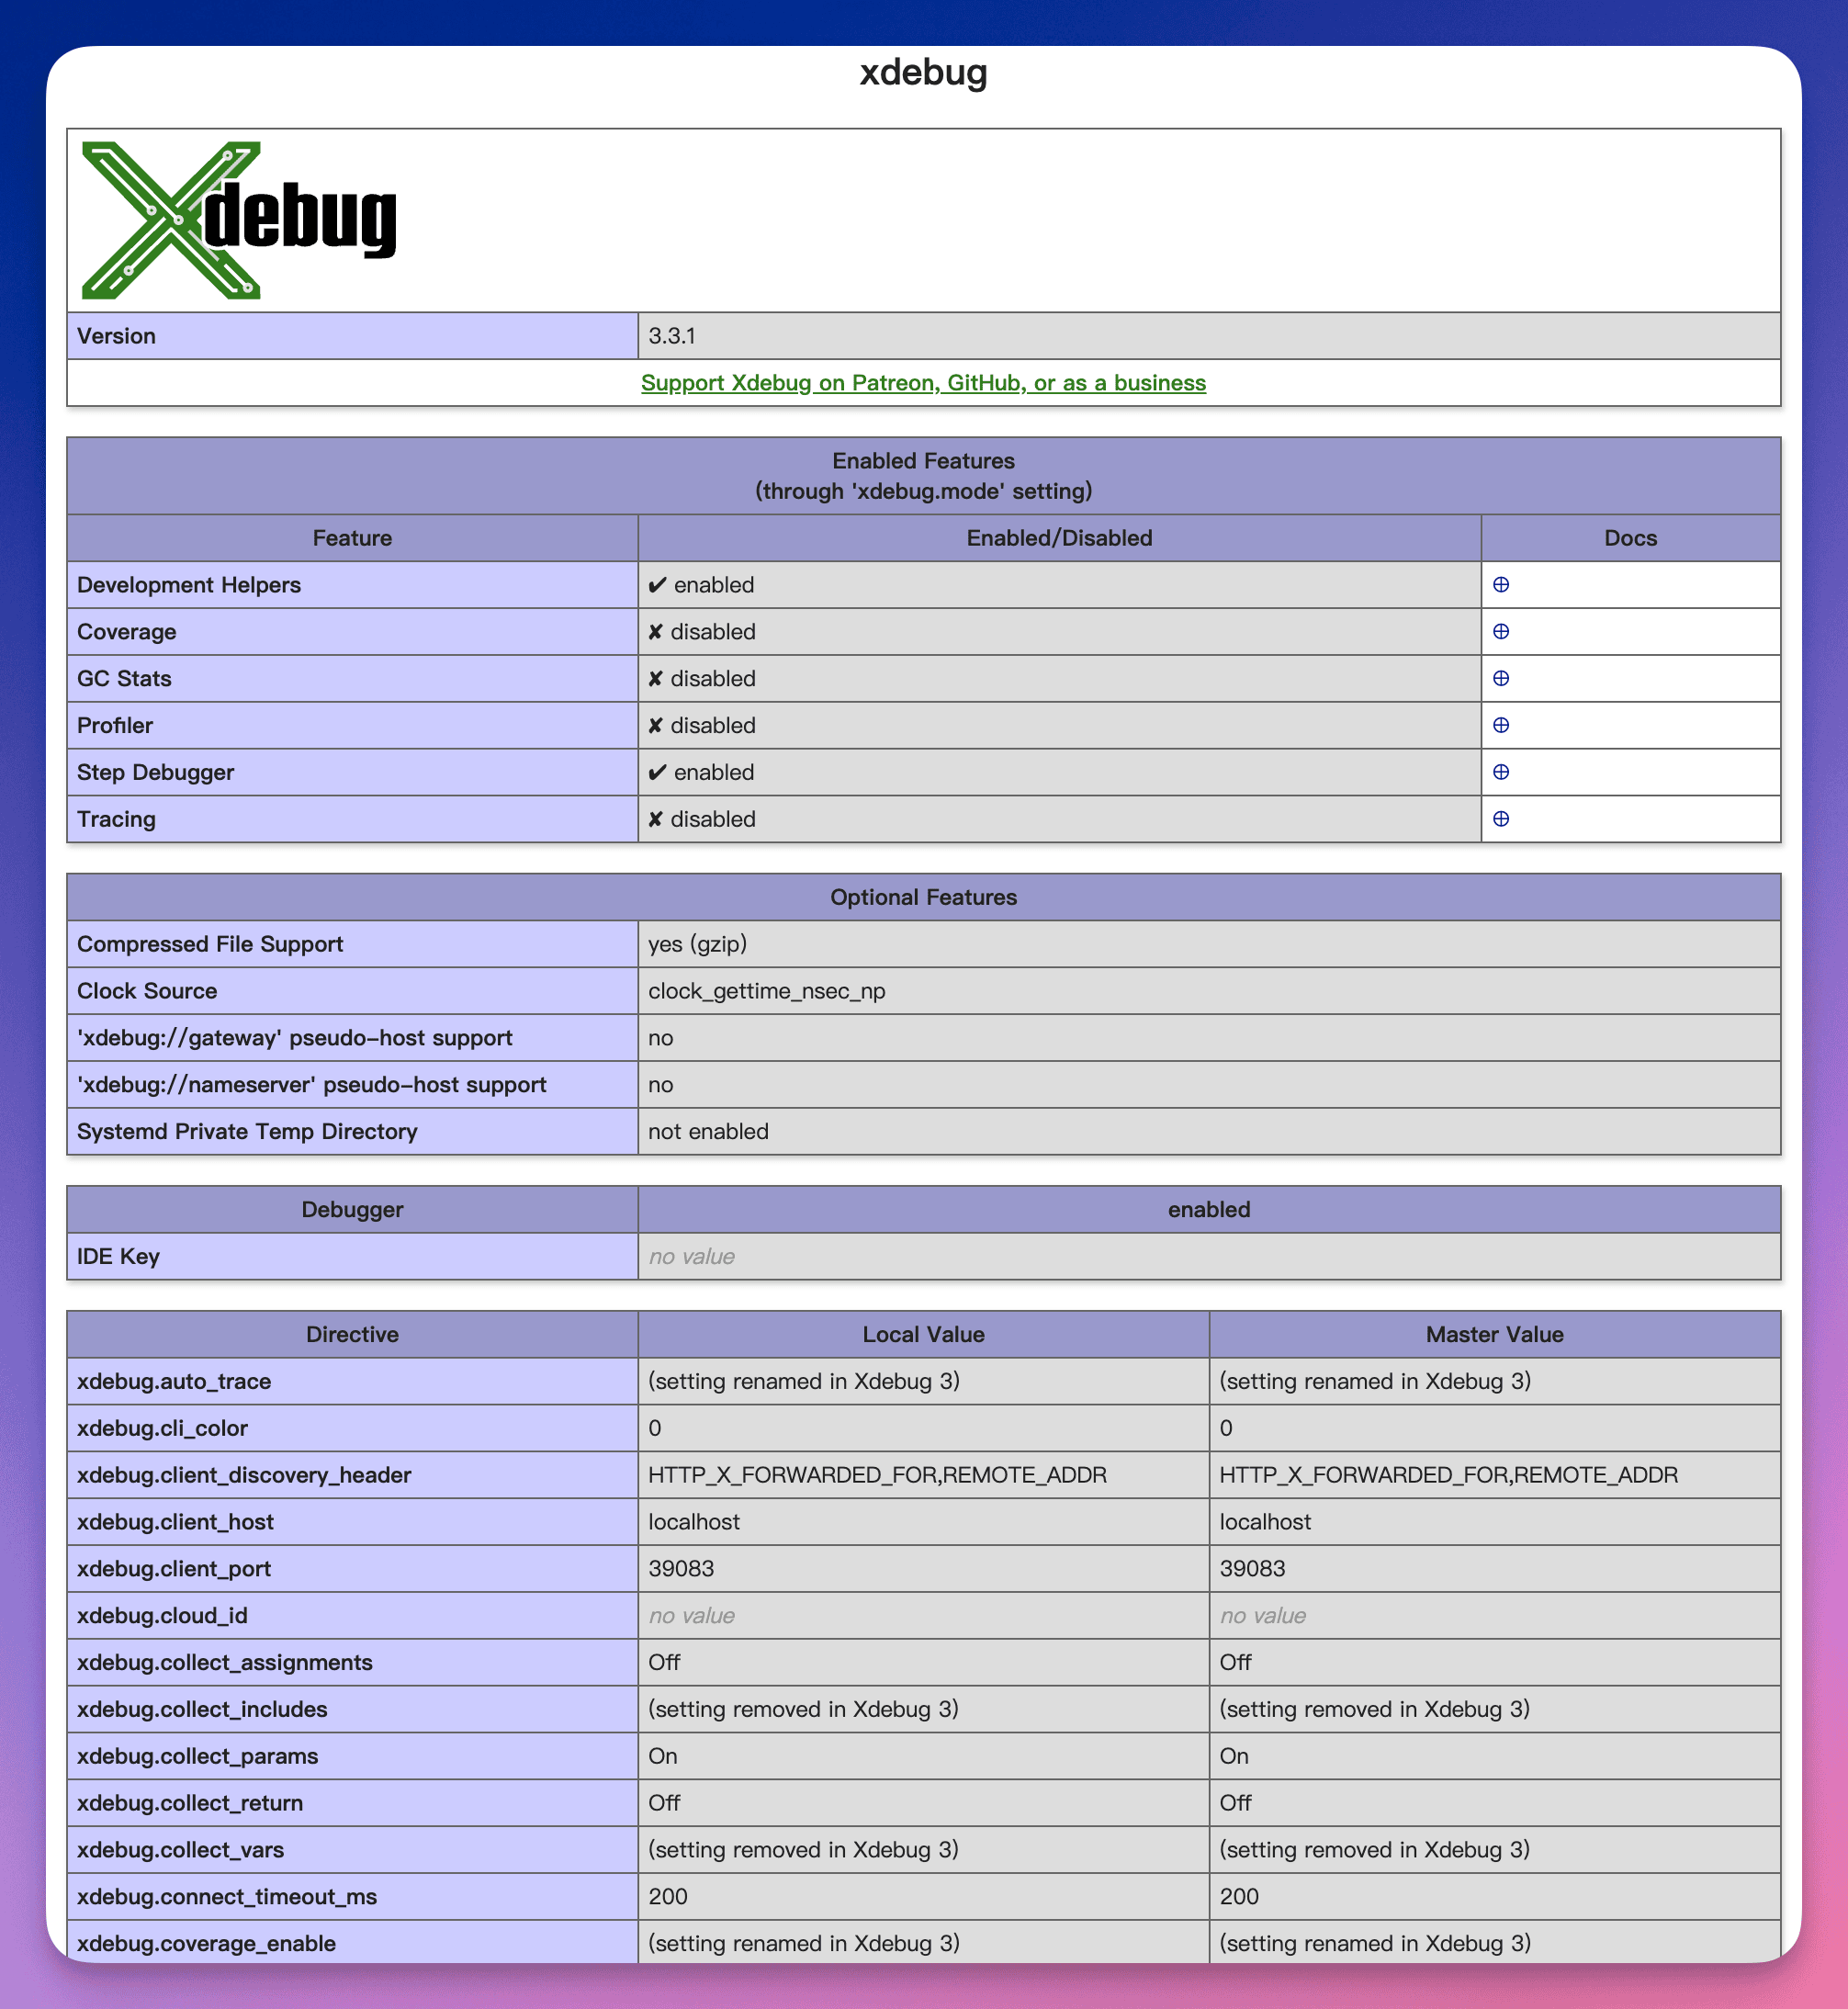
https://servbay.demo/phpinfo.php(thay thếservbay.demobằng domain bạn cấu hình trên ServBay). - Dò kiếm "Xdebug" trong trang
phpinfotrả về. Nếu Xdebug đã được nạp thành công, bạn sẽ thấy một mục cấu hình riêng cho "Xdebug" với thông tin phiên bản và các tham số cấu hình.
 Hình minh họa: Tìm thông tin Xdebug trong kết quả phpinfo
Cấu hình Xdebug để debug trong IDE
Chỉ bật Xdebug là chưa đủ, bạn còn cần cấu hình trên IDE (như PHPStorm hoặc VS Code) để sử dụng breakpoint, debug. Dưới đây là hướng dẫn chi tiết dành cho PHPStorm và Visual Studio Code (VS Code).
Cấu hình Xdebug trong PHPStorm
PHPStorm hỗ trợ Xdebug cực kỳ mạnh mẽ.
Mở cài đặt PHPStorm: Khởi chạy PHPStorm, vào menu
File->Settings(Windows/Linux) hoặcPHPStorm->Preferences(macOS).Cấu hình PHP CLI Interpreter:
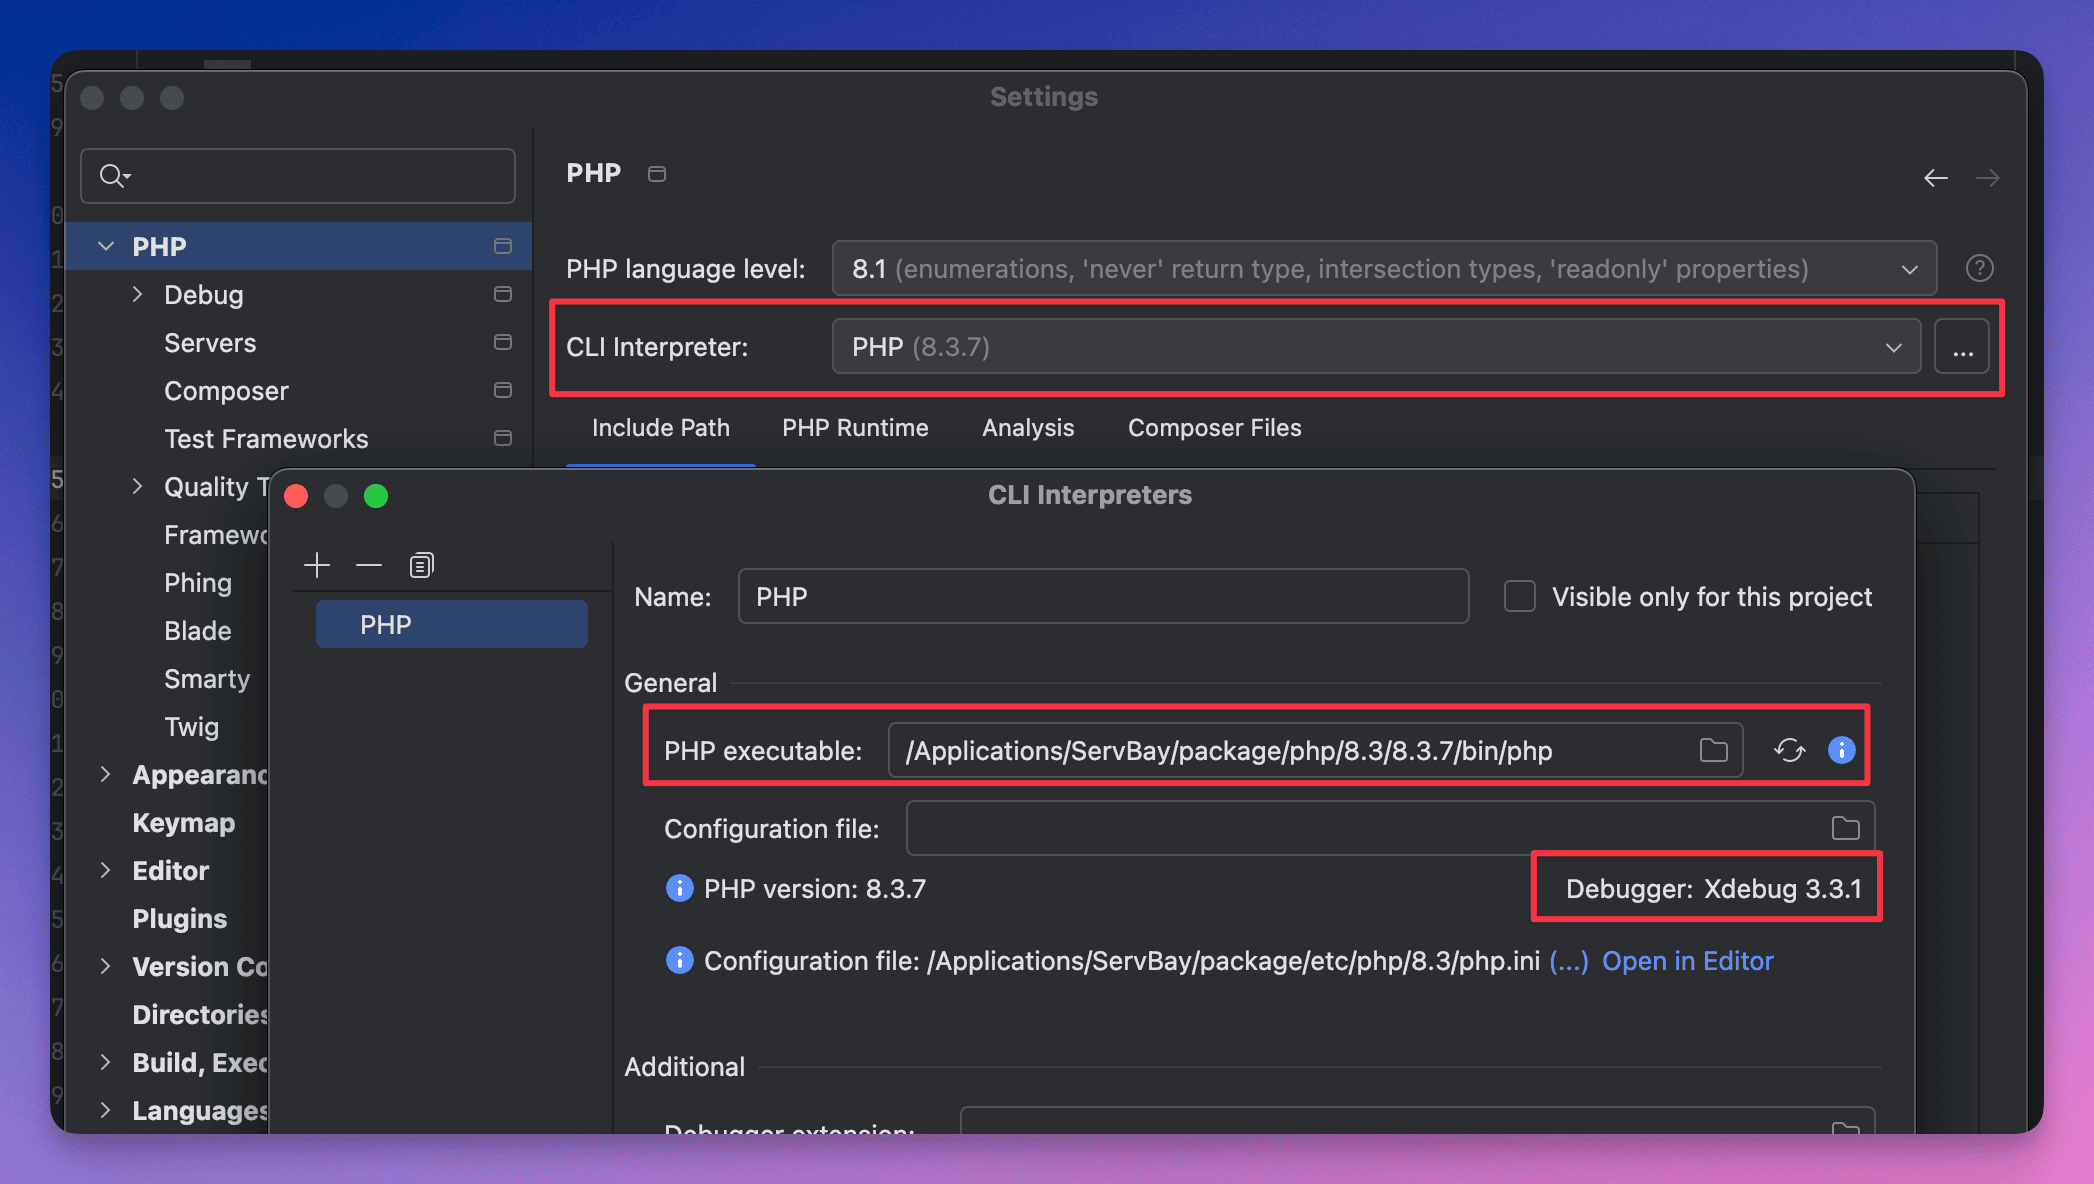
- Chọn
Languages & Frameworks->PHP. - Ở mục
CLI Interpreter, nhấn nút...bên phải. - Trong cửa sổ hiện ra, nhấn dấu
+để thêm CLI interpreter mới. - Trỏ tới file thực thi PHP CLI theo phiên bản trên ServBay, ví dụ:
/Applications/ServBay/package/php/8.3/8.3.7/bin/php(lưu ý version có thể khác, tuỳ theo cài đặt ServBay). - PHPStorm sẽ tự động nhận diện phiên bản và các extension, bao gồm cả Xdebug.
- Nhấn
OKđể lưu cấu hình Interpreter.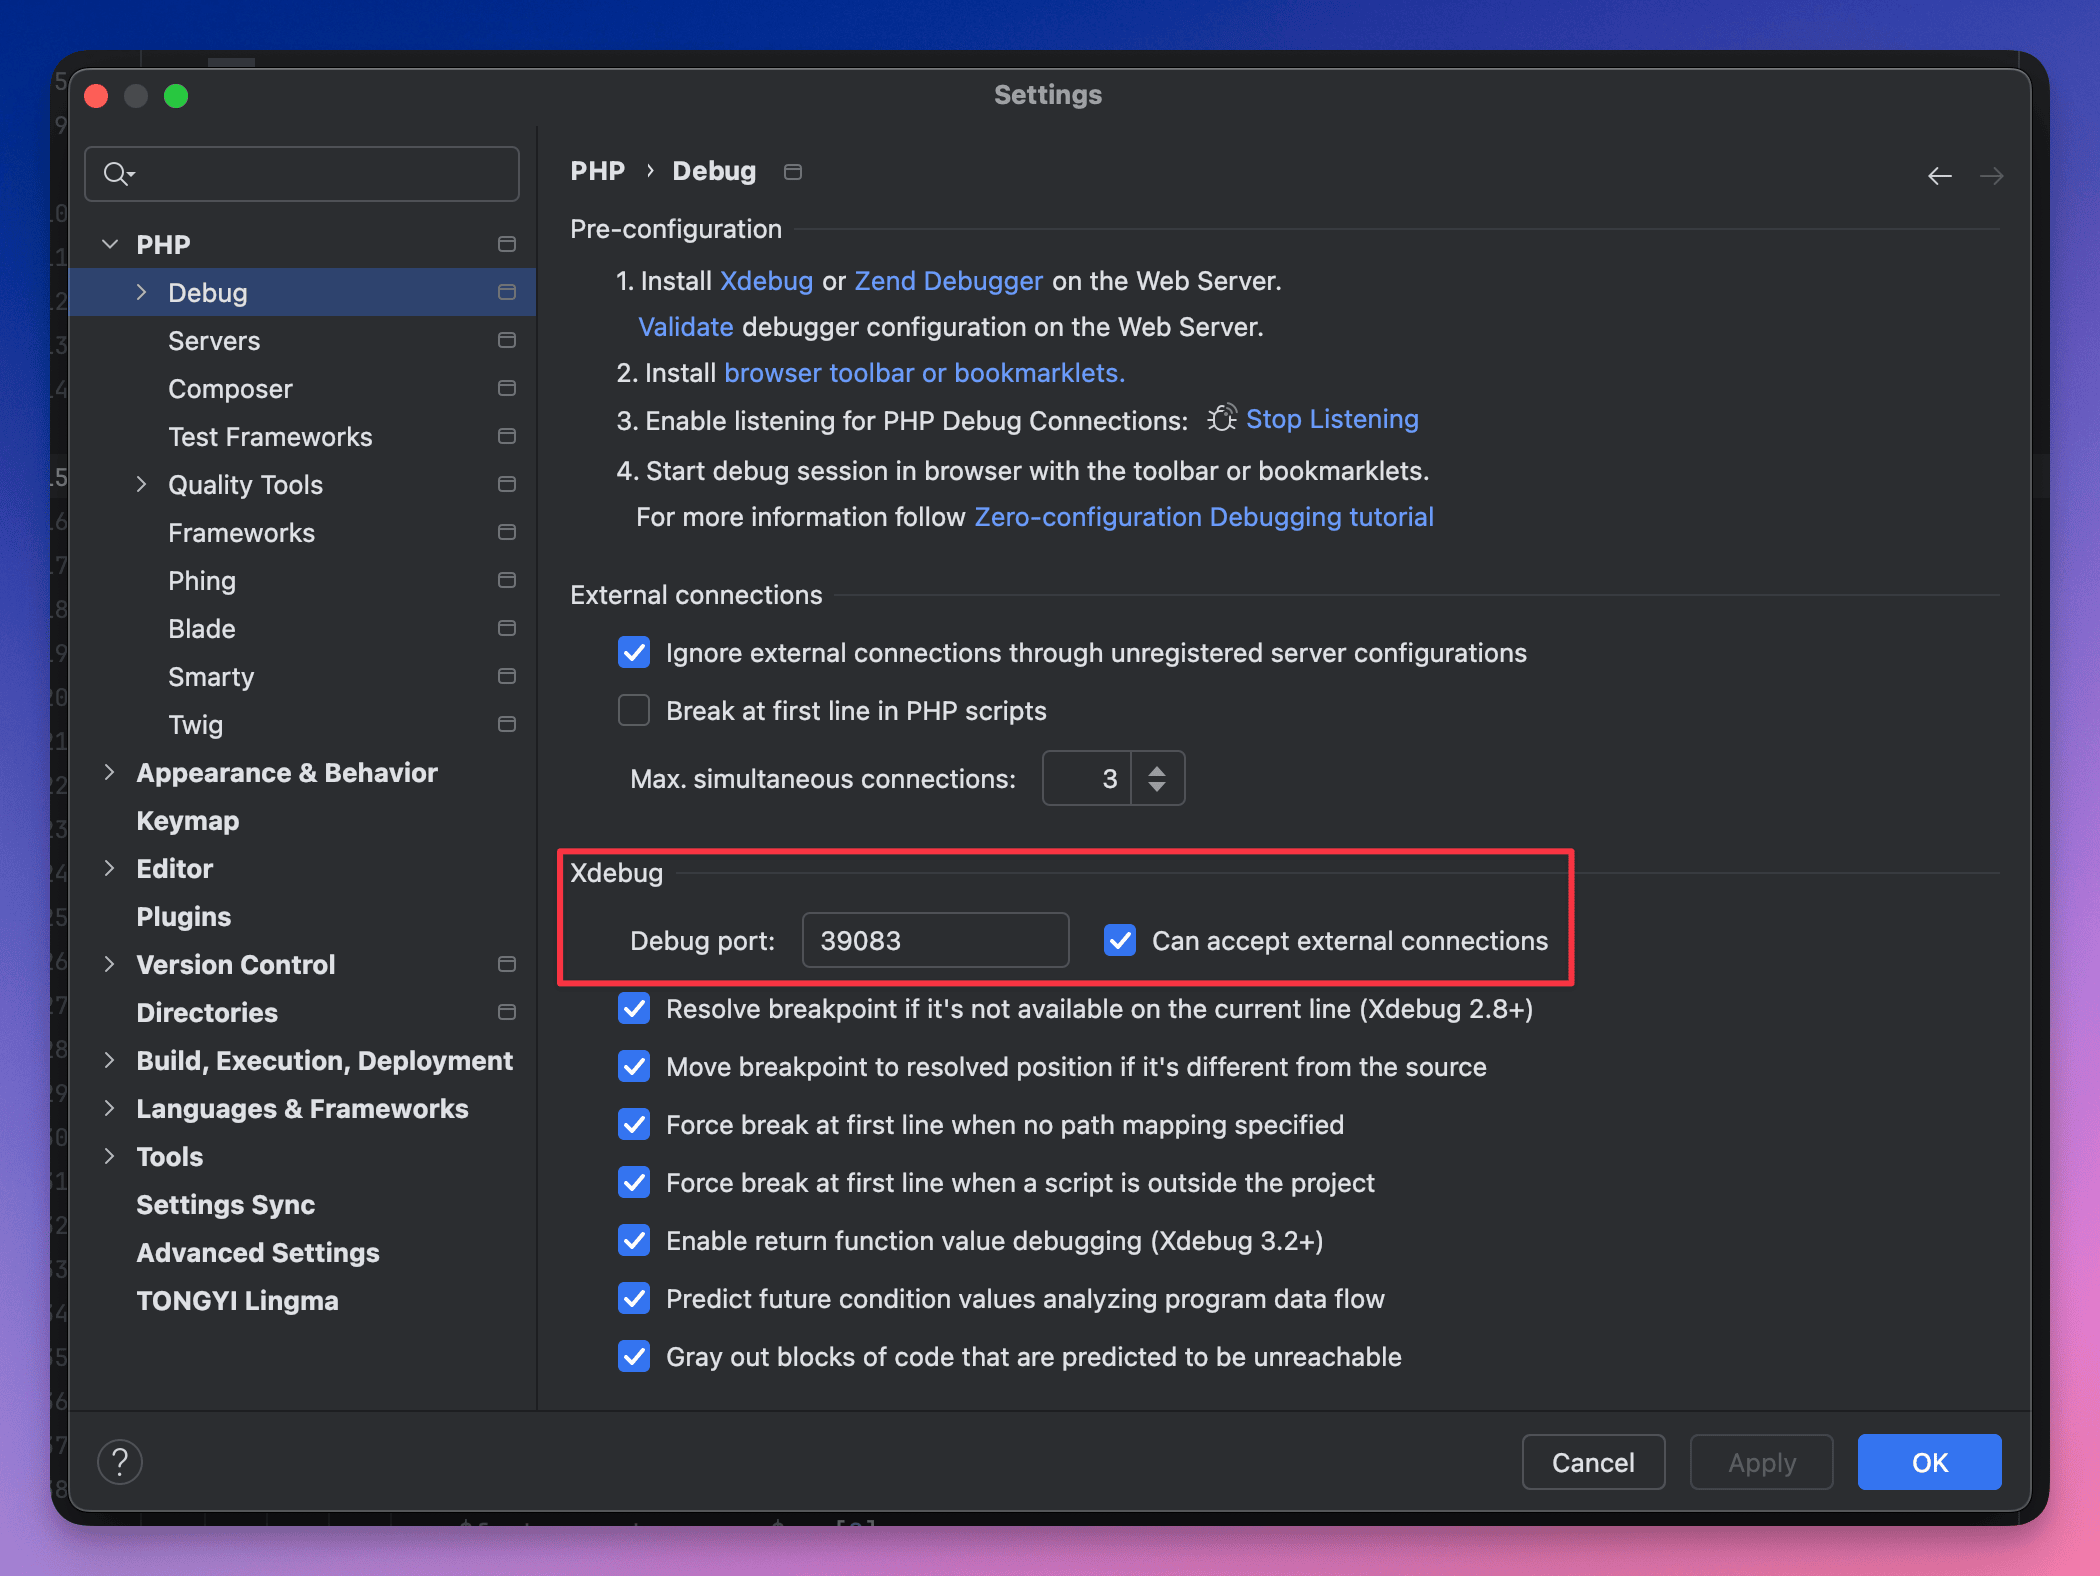 Hình minh họa: Cấu hình PHP CLI Interpreter của ServBay trên PHPStorm
- Chọn
Cài đặt tham số debug Xdebug:
- Chuyển tới
Languages & Frameworks->PHP->Debug. - Ở phần
Xdebug, đặtDebug Portđúng với cổng Xdebug của phiên bản PHP bạn bật trên ServBay (ví dụ PHP 8.3 là39083). Cổng này phải trùng với thiết lậpxdebug.client_port. - Tích chọn
Can accept external connections. - Nhấn
ApplyrồiOKđể lưu.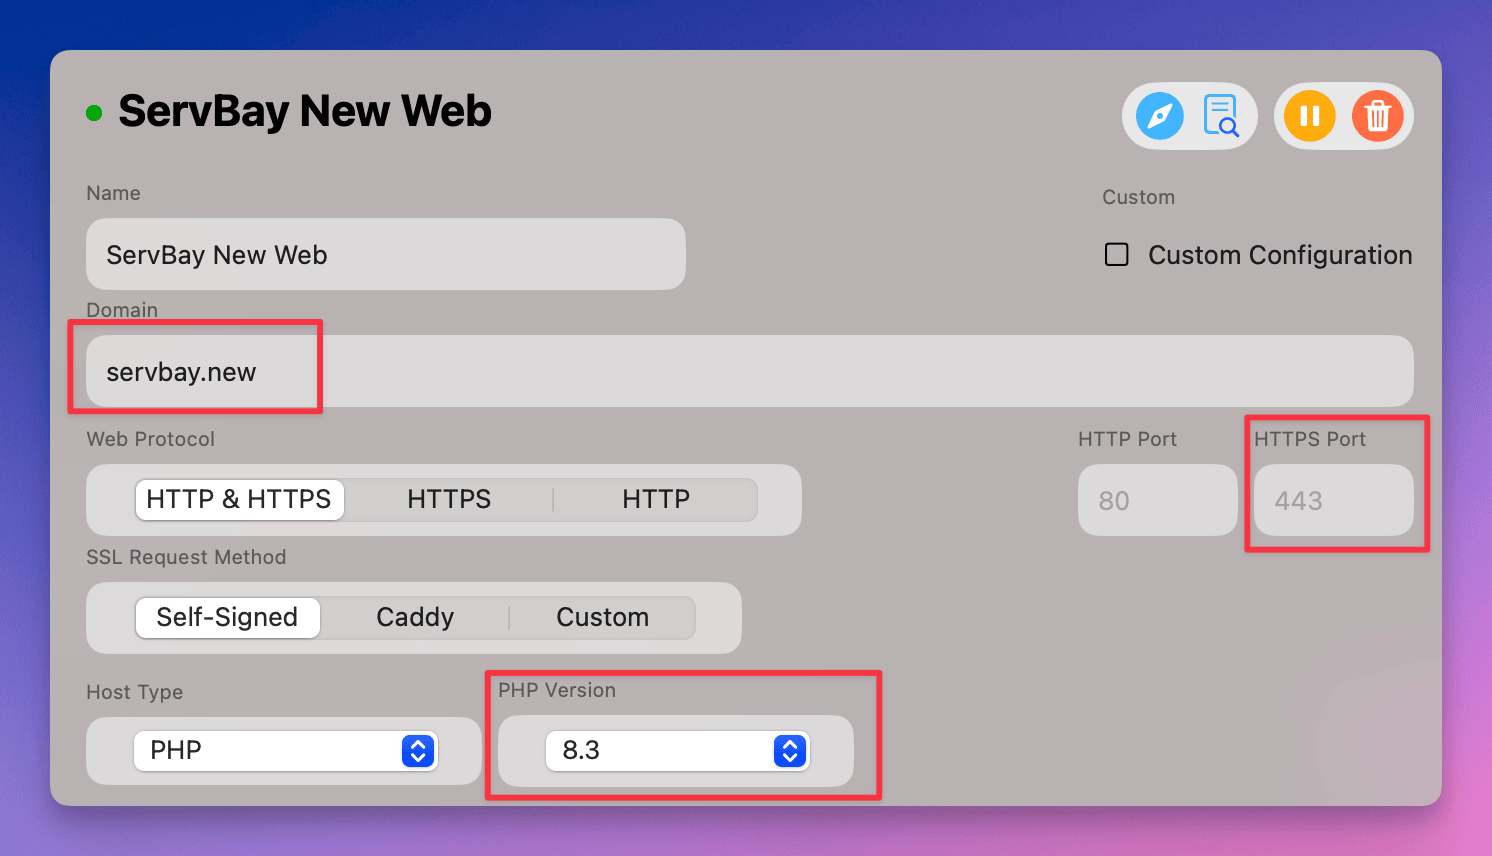 Hình minh họa: Cài đặt cổng lắng nghe cho Xdebug trên PHPStorm
- Chuyển tới
Cấu hình ánh xạ máy chủ Web (Servers):
- Vào
Languages & Frameworks->PHP->Servers. - Nhấn dấu
+và tạo cấu hình máy chủ mới. - Đặt tên máy chủ, ví dụ
ServBay Localhost. - Điền tên miền bạn dùng trên ServBay vào
Host(ví dụservbay.demo). - Điền
Port, thường là443(HTTPS) hoặc80(HTTP). - Chọn
DebuggerlàXdebug. - Tích chọn
Use path mappings. - Cấu hình ánh xạ đường dẫn local với server. Thông thường, nếu dự án đặt tại
/Applications/ServBay/www/myprojecttruy cập quahttps://servbay.demo/, ánh xạ từ/Applications/ServBay/www/myprojectsang/trên server. Nếu bạn dùng domain kiểuhttps://myproject.servbay.demo/thì ánh xạ từ/Applications/ServBay/www/myprojecttới/cũng vẫn đúng. Cấu hình ánh xạ chuẩn là mấu chốt để Xdebug hoạt động. - Nhấn
OKđể lưu thiết lập.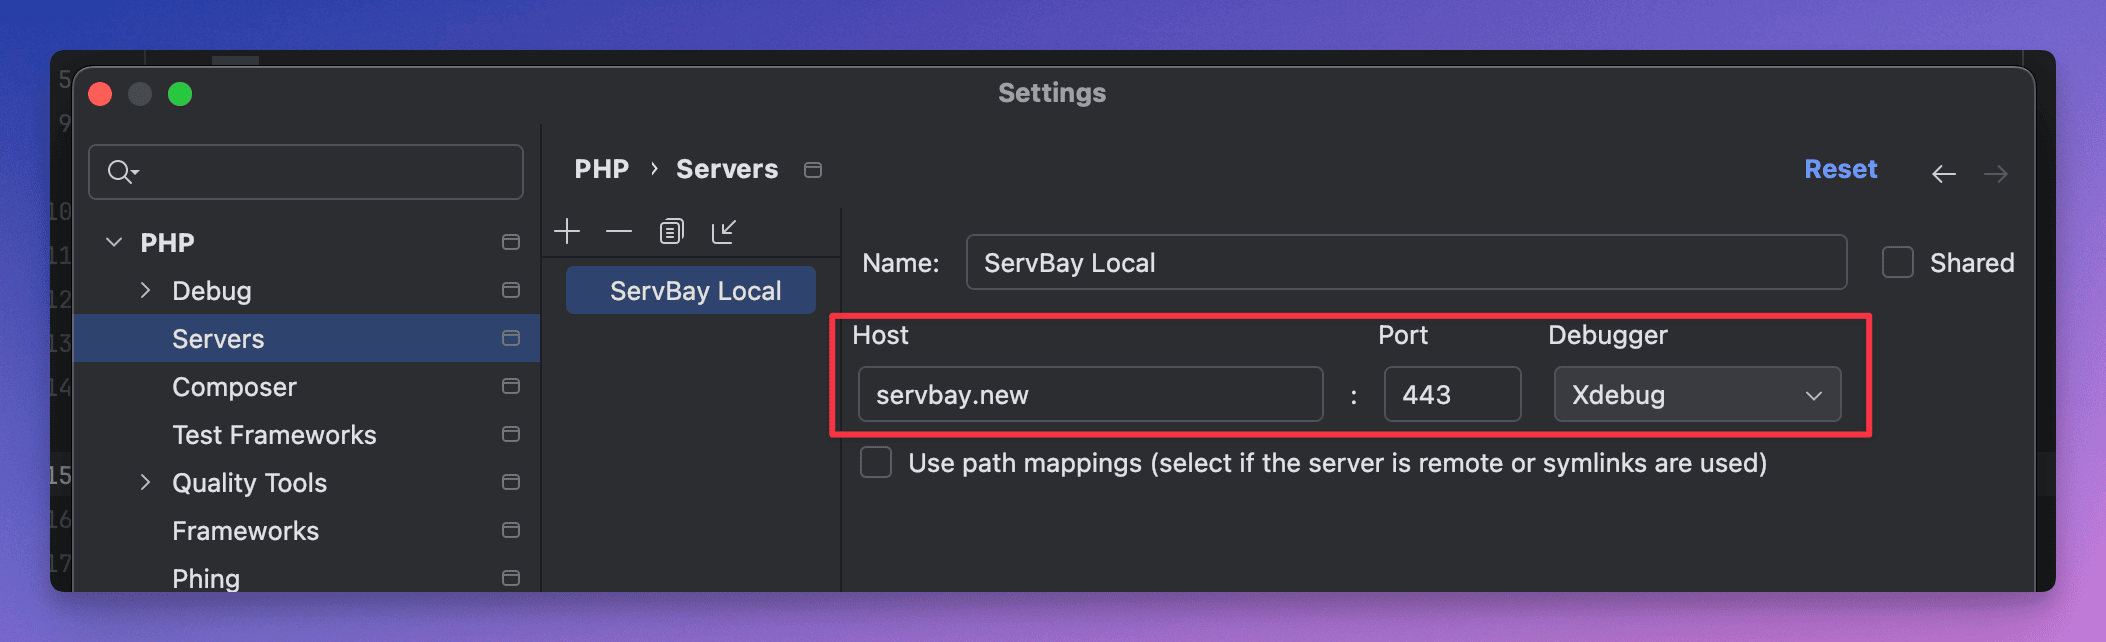
 Hình minh họa: Thiết lập Servers và ánh xạ đường dẫn trên PHPStorm
- Vào
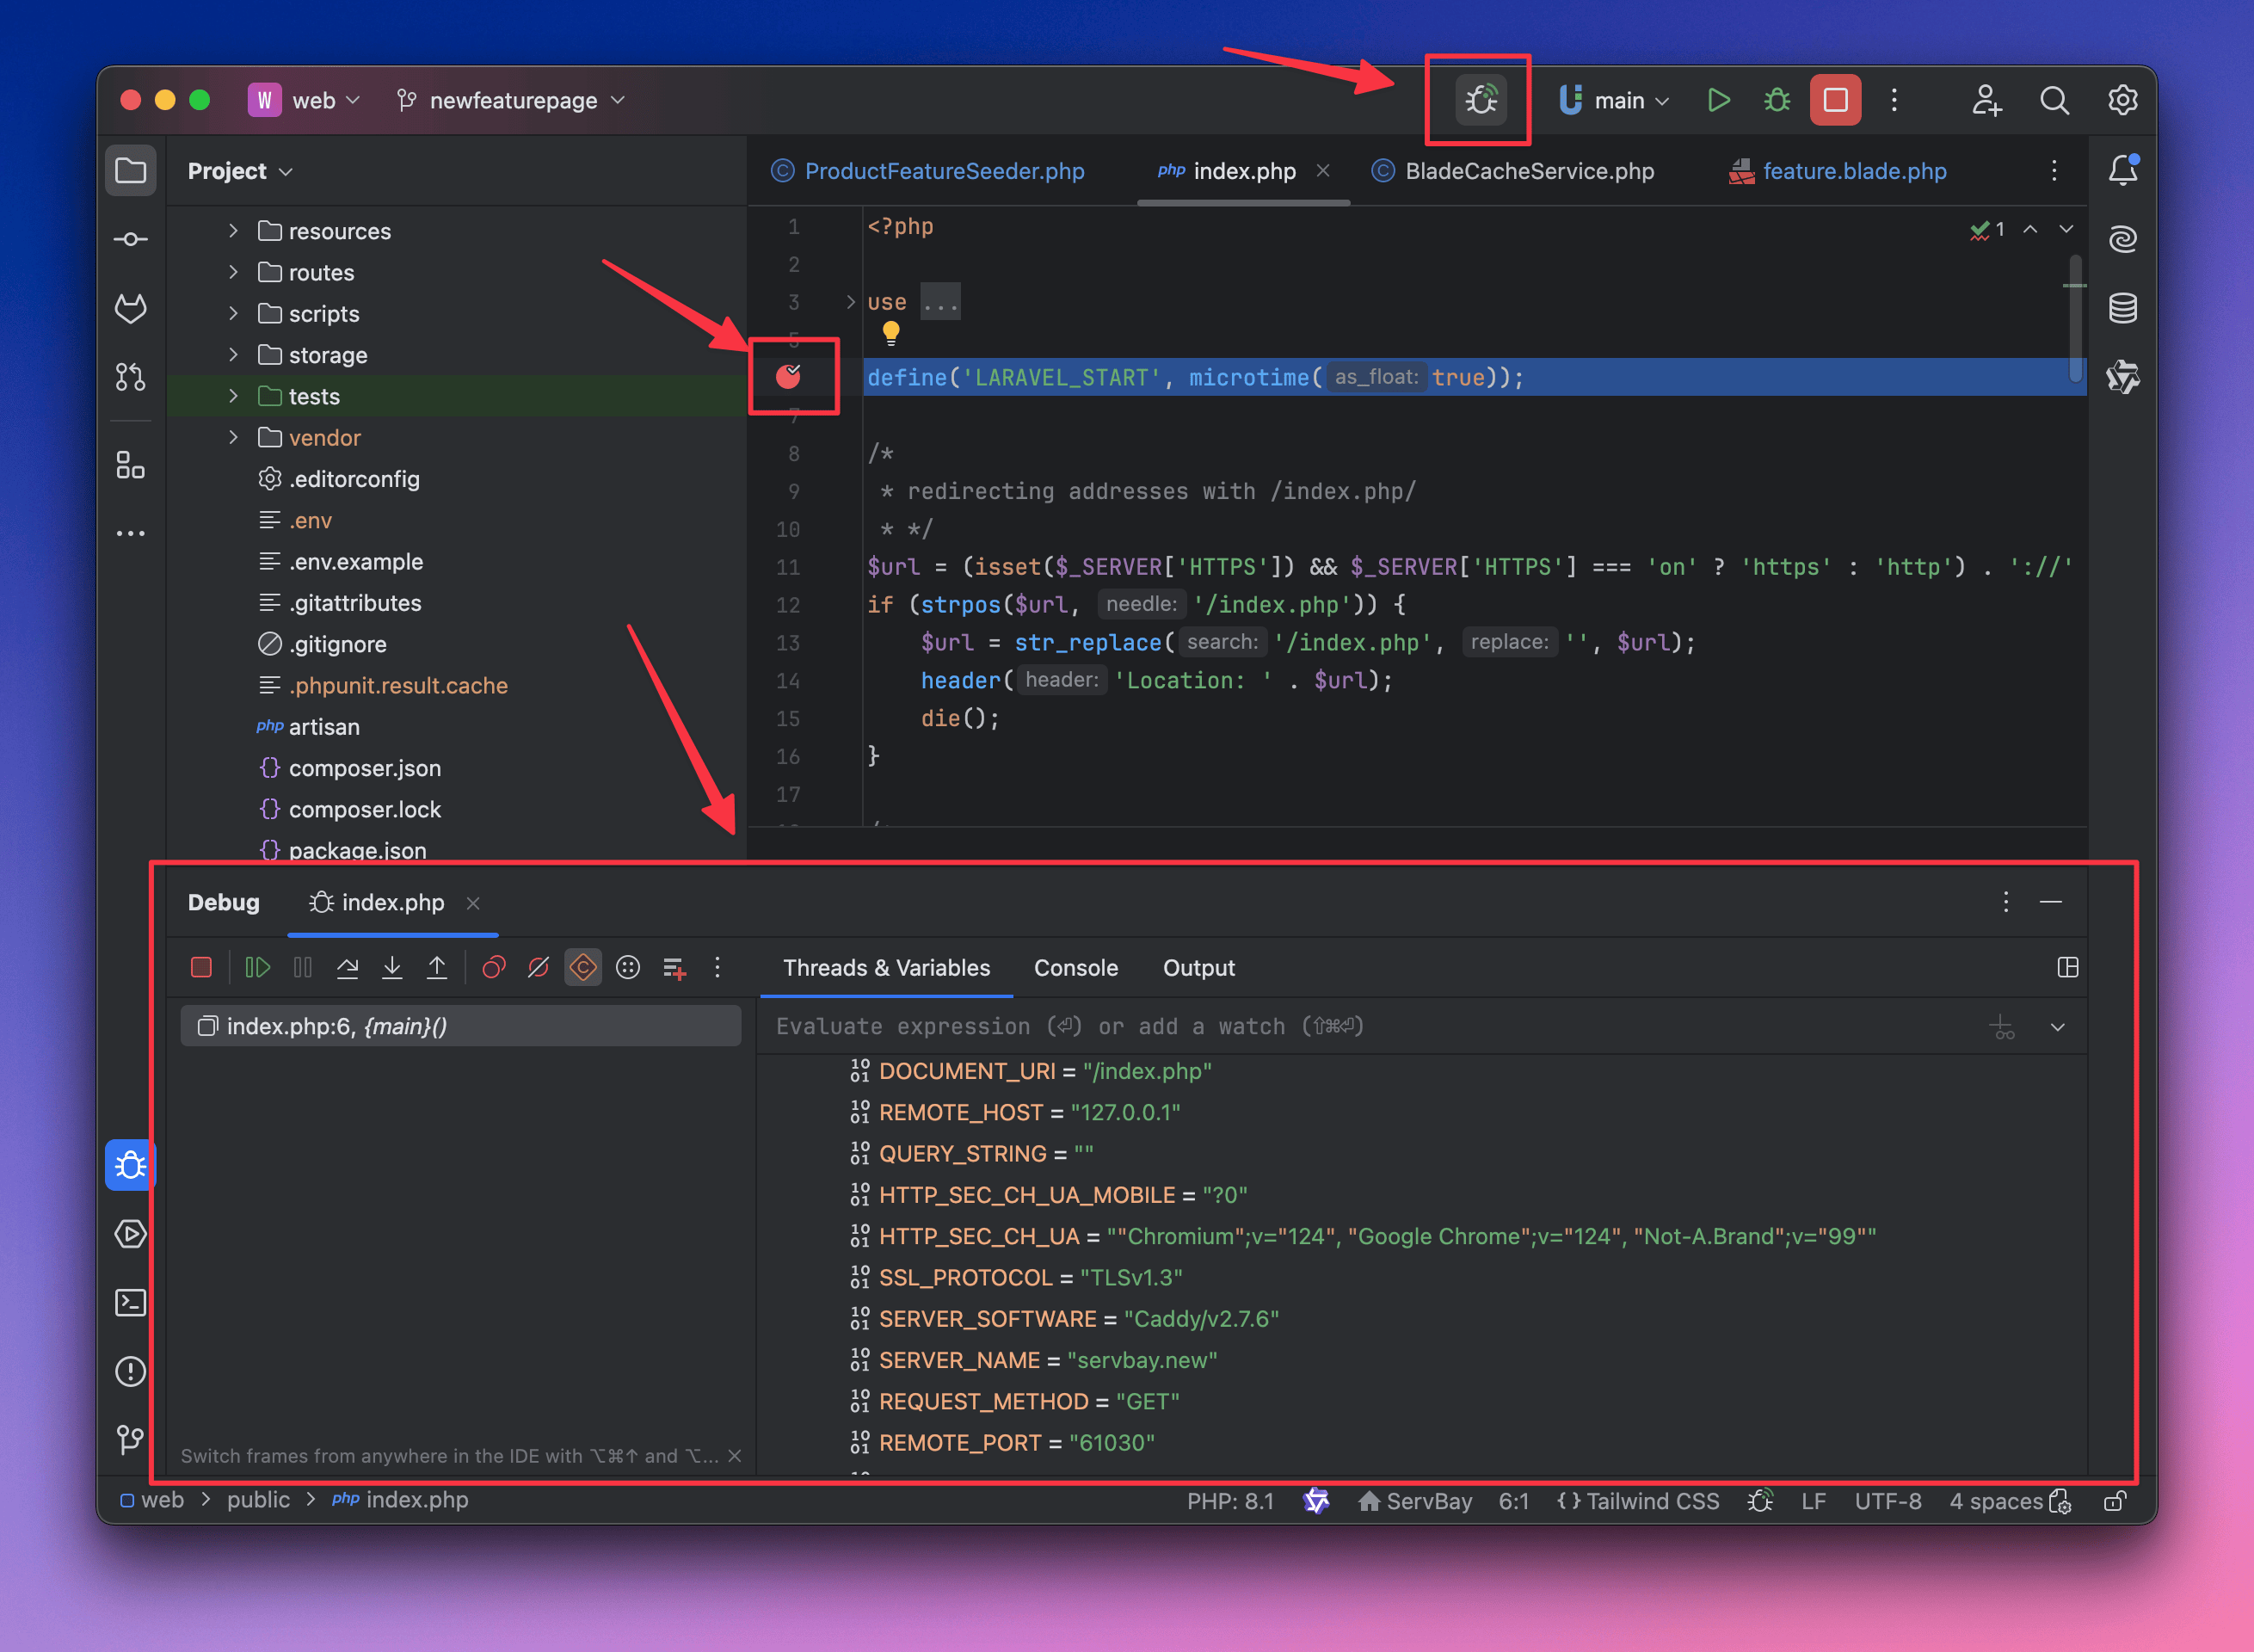
Khởi động phiên debug:
- Mở file PHP bạn muốn debug trên PHPStorm.
- Đặt breakpoint (nhấn vào lề trái của dòng mã, xuất hiện chấm đỏ).
- Nhấn biểu tượng "Start Listening for PHP Debug Connections" (hình con bọ) trên toolbar của PHPStorm; biểu tượng chuyển thành màu xanh nghĩa là đang lắng nghe kết nối Xdebug.
- Vào trình duyệt truy cập ứng dụng PHP (ví dụ
https://servbay.demo/index.php). - Nếu mọi thứ đúng chuẩn, Xdebug sẽ tự động kết nối với PHPStorm và dừng lại tại breakpoint bạn đặt, cho phép bạn debug trực tiếp trên IDE.
 Hình minh họa: Bật chức năng lắng nghe Xdebug trên PHPStorm
Cấu hình Xdebug trong Visual Studio Code (VS Code)
VS Code là trình chỉnh sửa mã phổ biến, qua extension có thể debug PHP với Xdebug.
Cài đặt extension PHP Debug:
- Mở VS Code.
- Nhấn
Ctrl+Shift+XhoặcCmd+Shift+Xđể vào giao diện Extension. - Tìm và cài extension "PHP Debug" của Felix Becker.
Cấu hình
launch.json:- Mở folder dự án PHP trên VS Code.
- Bấm
Ctrl+Shift+DhoặcCmd+Shift+Dđể mở Run & Debug view. - Nhấn nút bánh răng, chọn "PHP". VS Code sẽ tạo file
launch.jsontrong thư mục.vscodecủa dự án. - Chỉnh sửa
launch.json, đảm bảo mục "Listen for Xdebug" có sốporttrùng với cổng Xdebug của PHP phiên bản bạn bật trên ServBay (VD: PHP 8.3 là39083). - Cấu hình path mapping (ánh xạ đường dẫn): Đây là bước then chốt để debug thành công. Trong
launch.json, thêm hoặc sửapathMappingsmapping từ đường dẫn trên server tới local project:jsonChỉnh sửa{ "version": "0.2.0", "configurations": [ { "name": "Listen for Xdebug", "type": "php", "request": "launch", "port": 39083, // Đổi thành cổng Xdebug phù hợp "pathMappings": { // Mapping từ đường dẫn trên ServBay server tới local // VD: dự án tại /Applications/ServBay/www/myproject // truy cập qua https://servbay.demo/ thì "/" map với "${workspaceRoot}" "/": "${workspaceRoot}" // Nếu truy cập qua https://myproject.servbay.demo/ cũng tương tự // "/": "${workspaceRoot}" // Áp dụng như trên } }, { "name": "Launch currently open script", "type": "php", "request": "launch", "program": "${file}", "cwd": "${fileDirname}", "port": 39083 // Đổi thành cổng Xdebug phù hợp } ] }pathMappingstheo cấu trúc dự án và cấu hình website trên ServBay.${workspaceRoot}thường là thư mục gốc dự án mà bạn mở trên VS Code.
Bắt đầu debug:
- Mở file PHP cần debug trong VS Code.
- Đặt breakpoint (nhấn chuột vào lề trái).
- Bấm
Ctrl+Shift+DhoặcCmd+Shift+Dđể chuyển sang chế độ debug. - Trong dropdown debug ở trên cùng, chọn "Listen for Xdebug".
- Nhấn nút Tam giác xanh để bắt đầu session debug. Thanh trạng thái VS Code sẽ chuyển màu cam để báo là đang lắng nghe Xdebug.
- Truy cập ứng dụng PHP trên trình duyệt. Nếu thiết lập đúng, Xdebug sẽ kết nối với VS Code và dừng tại breakpoint.
Các câu hỏi thường gặp (FAQ)
Q: Không thấy module Xdebug trên
phpinfo()?- A: Hãy đảm bảo bạn đã bật Xdebug qua GUI ServBay hoặc sửa file cấu hình
xdebug.ini. - Đừng quên khởi động lại dịch vụ PHP sau khi thay đổi.
- Kiểm tra đường dẫn file
xdebug.iniđúng chưa và dòngzend_extension = xdebug.sođã bỏ comment. - Xem log của ServBay (
/Applications/ServBay/logs/php/<version>/error.log) để kiểm tra lỗi load Xdebug.
- A: Hãy đảm bảo bạn đã bật Xdebug qua GUI ServBay hoặc sửa file cấu hình
Q: Chạy debug trên IDE nhưng breakpoint không hiệu quả?
- A: Đảm bảo IDE đang lắng nghe Xdebug (biểu tượng con bọ của PHPStorm đổi xanh, thanh trạng thái VS Code chuyển cam).
- Kiểm tra cổng Xdebug trong cấu hình IDE có trùng với cổng
xdebug.client_portđã cấu hình và đúng với từng phiên bản PHP. - Kiểm tra lại ánh xạ đường dẫn (Path Mapping) trong IDE xem đã đúng chưa; đây là nguyên nhân thường gặp khiến debug không hoạt động.
- Kiểm tra firewall, đảm bảo không chặn cổng Xdebug (mặc định là chuỗi cổng
390xx). - Nếu cấu hình
xdebug.start_with_request=triggertrongxdebug.ini, hãy đảm bảo bạn có gửi trigger (bằng extension Xdebug trên browser, hoặc thêm?XDEBUG_TRIGGER=1vào URL).
Q: Kết nối Xdebug bị ngắt sau một thời gian?
- A: Kiểm tra các tham số
xdebug.remote_autostarthoặcxdebug.start_with_requesttrong file xdebug.ini. Nếu đặt làyes, Xdebug sẽ khởi động debug cho mọi request, có thể gây mất kết nối. Nên chọntrigger. - Kiểm tra timeout trong thiết lập debug của IDE.
- A: Kiểm tra các tham số
Kết luận
ServBay với Xdebug tích hợp và quy trình cấu hình đơn giản, hạ thấp đáng kể rào cản cho lập trình viên PHP khi kích hoạt và sử dụng Xdebug. Dù thao tác với giao diện trực quan hay tự chỉnh file cấu hình, bạn đều có thể dễ dàng bật Xdebug trên mọi phiên bản PHP của ServBay. Kết hợp sức mạnh debug của PHPStorm/VS Code, bạn sẽ tối ưu hiệu quả debug mã, phân tích hiệu suất, đảm bảo chất lượng sản phẩm và nâng tầm quá trình phát triển của mình. Thành thạo cách kết hợp ServBay và Xdebug sẽ là vũ khí lợi hại cho mọi workflow phát triển PHP local của bạn.