Как включить и настроить модуль Xdebug в ServBay
ServBay — это мощная локальная среда веб-разработки, которая заранее интегрирует инструменты для отладки и профилирования PHP, такие как Xdebug. Использование Xdebug значительно повышает эффективность разработки приложений на PHP, упрощает процесс отладки кода, анализа производительности и проверки покрытия кода тестами. В этой статье вы узнаете, как включить и настроить Xdebug в ServBay, а также как интегрировать его с популярными IDE.
Обзор модуля Xdebug
Xdebug — это функциональное расширение PHP, предназначенное для отладки и профилирования кода. Благодаря предустановке Xdebug в ServBay, разработчикам больше не нужно заниматься его ручной компиляцией и установкой — включить и настроить расширение очень просто.
Основные возможности Xdebug
- Отладка с использованием точек останова: Позволяет установить точку останова на конкретной строке кода и автоматически приостанавливать выполнение программы для анализа переменных, call stack и пошагового прохождения.
- Пошаговая отладка: Поддерживает операции "шаг за шагом" (Step Over), вход в функцию (Step Into) и выход из функции (Step Out), что помогает отслеживать логику выполнения программы.
- Мониторинг переменных: Позволяет в реальном времени контролировать значения локальных и глобальных переменных во время отладки.
- Анализ стека вызовов: При ошибках или исключениях Xdebug отображает подробный стек вызовов функций, чтобы быстрее находить источник проблем.
- Профилирование производительности: Генерирует отчёты о скорости выполнения кода, помогая выявить узкие места.
- Проверка покрытия кода: Измеряет, какая часть программы была охвачена тестами — важно для оценки эффективности тестирования.
Встроенные версии Xdebug и сопоставление портов в ServBay
ServBay предустанавливает подходящий модуль Xdebug для каждой версии PHP. Обратите внимание: для каждой версии PHP используется собственный порт для прослушивания Xdebug, связанный с номером версии PHP. Это важно при настройке интеграции с IDE.
| Версия PHP | Версия Xdebug | Стандартный порт Xdebug |
|---|---|---|
| PHP 5.6 | Xdebug 2.5.5 | 39056 |
| PHP 7.0 | Xdebug 2.5.5 | 39070 |
| PHP 7.1 | Xdebug 2.5.5 | 39071 |
| PHP 7.2 | Xdebug 3.1.6 | 39072 |
| PHP 7.3 | Xdebug 3.1.6 | 39073 |
| PHP 7.4 | Xdebug 3.1.6 | 39074 |
| PHP 8.0 | Xdebug 3.3.1 | 39080 |
| PHP 8.1 | Xdebug 3.4.0 | 39081 |
| PHP 8.2 | Xdebug 3.4.0 | 39082 |
| PHP 8.3 | Xdebug 3.4.0 | 39083 |
| PHP 8.4 | Xdebug 3.4.0 | 39084 |
| PHP 8.5 | Xdebug 3.4.0 | 39085 |
Правило портов
Правило по умолчанию для портов Xdebug: 39000 + младший номер версии PHP. Например, для PHP 8.3 порт будет 39000 + 83 = 39083, а для PHP 7.4 — 39000 + 74 = 39074. Понимание этого правила позволяет быстро определить порт Xdebug для нужной версии PHP.
Как включить модуль Xdebug
В ServBay активация Xdebug чрезвычайно проста — рекомендуется использовать графический интерфейс пользователя (GUI) ServBay, но также можно включить модуль вручную через конфигурационные файлы.
Включение Xdebug через GUI ServBay
Это самый быстрый и лёгкий способ.
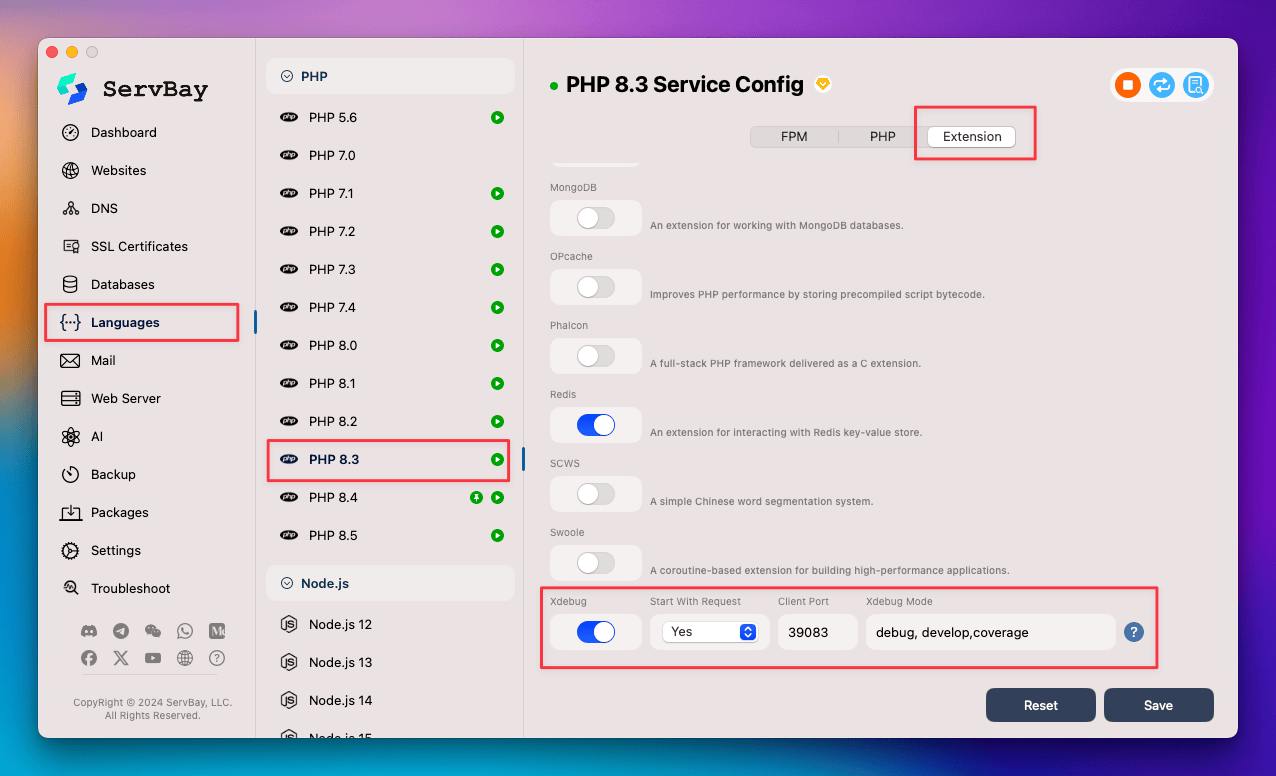
- Откройте интерфейс приложения ServBay.
- В левой панели навигации выберите раздел
Языки(Languages). - Разверните раздел
PHP. Найдите ту версию PHP, для которой требуется включить Xdebug, напримерPHP 8.3. - Нажмите кнопку
Модулинапротив выбранной версии. - В появившемся списке расширений найдите модуль
Xdebug. - Переключите тумблер слева от модуля
Xdebugиз выключенного в включенный режим. - При необходимости измените параметры.
- В нижней части интерфейса нажмите кнопку
Сохранить. - ServBay автоматически перезапустит процесс PHP и подключит модуль.
 На иллюстрации: включение Xdebug в разделе Модули
Проверка успешного подключения модуля Xdebug
Наиболее надёжная проверка — просмотр информации о конфигурации PHP с помощью функции phpinfo().
- В каталоге сайта ServBay (по умолчанию
/Applications/ServBay/www) создайте простой PHP-файл, напримерphpinfo.php. - Добавьте в файл
phpinfo.phpследующее содержимое:php<?php phpinfo(); ?> - Откройте этот файл в браузере, например по адресу
https://servbay.demo/phpinfo.php(заменитеservbay.demoна соответствующий домен сайта, указанный в ServBay). - На странице с выводом
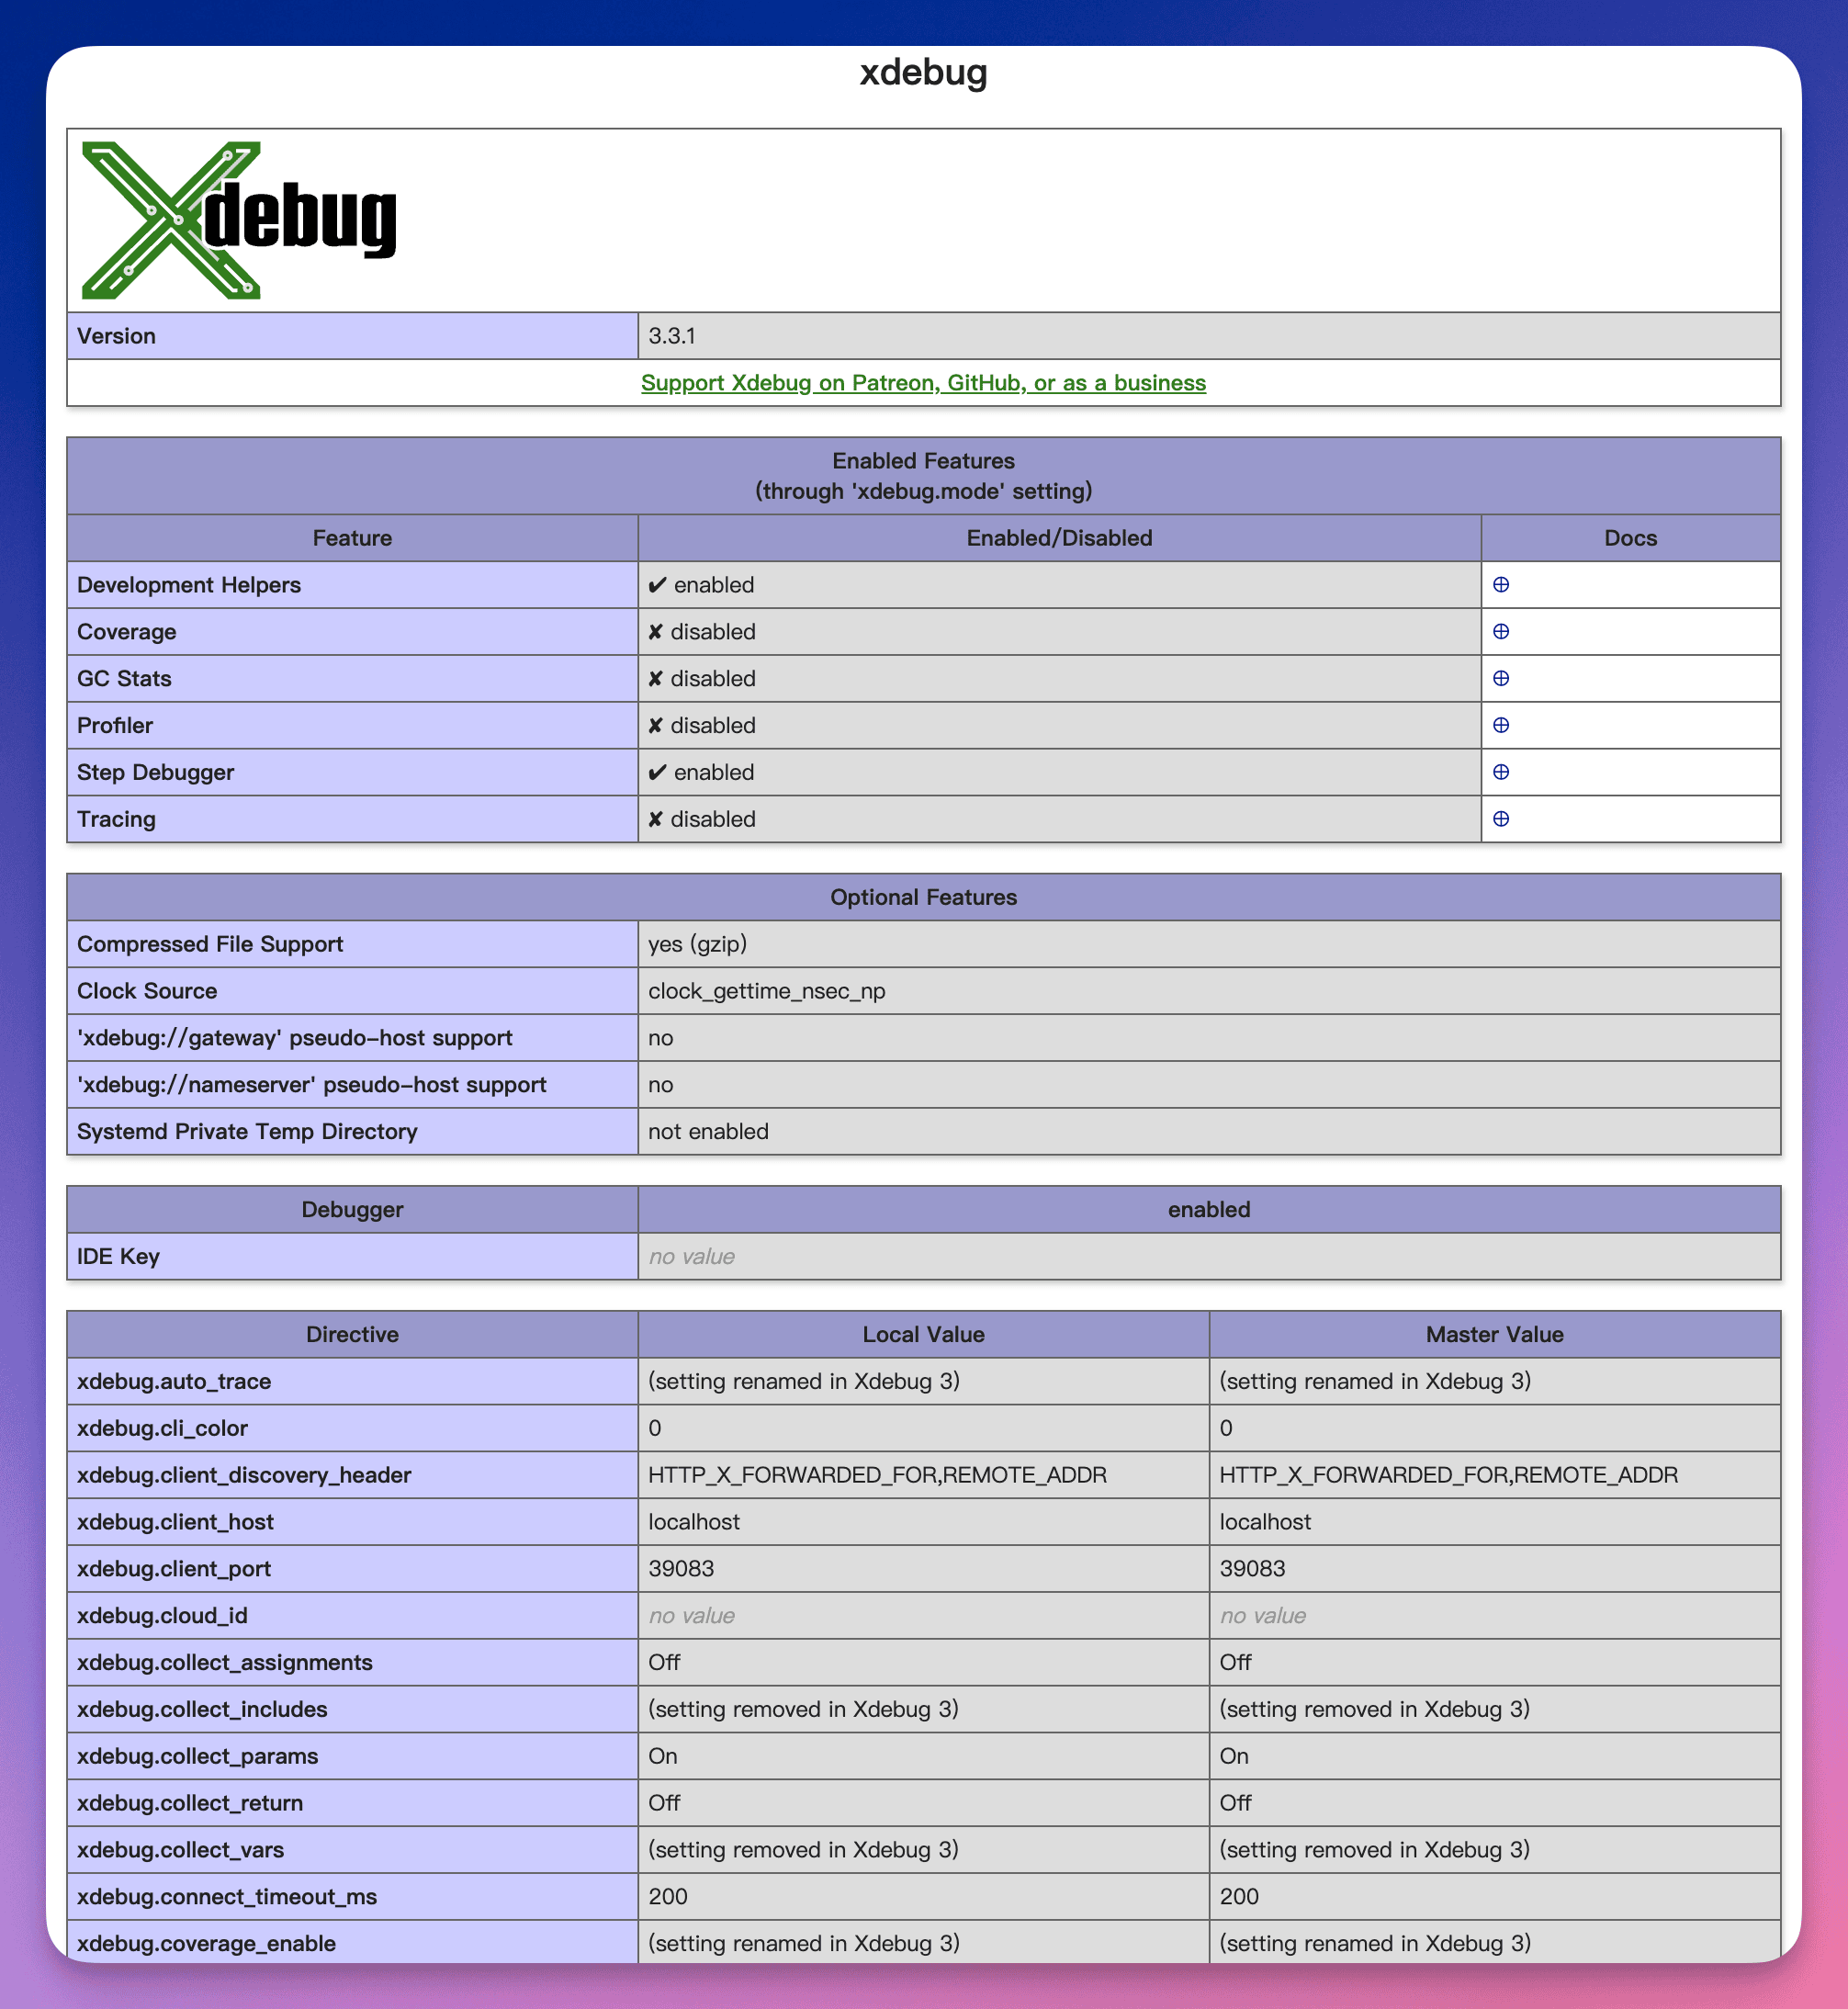
phpinfoнайдите секцию "Xdebug". Если модуль Xdebug успешно загружен, вы увидите отдельный блок конфигурации с информацией о его версии и текущих параметрах.
 На иллюстрации: поиск Xdebug в выводе phpinfo
Настройка Xdebug для отладки в IDE
Включение Xdebug — это только первый шаг. Для работы с отладчиком в IDE нужно также указать правильный интерпретатор PHP, параметры отладки и настроить маппинг серверов. Ниже рассмотрены примеры для PHPStorm и Visual Studio Code (VS Code).
Настройка Xdebug в PHPStorm
PHPStorm прекрасно поддерживает интеграцию с Xdebug.
Откройте настройки PHPStorm: Запустите программу и пройдите через меню
File->Settings(Windows/Linux) илиPHPStorm->Preferences(macOS).Настройте интерпретатор PHP CLI:
- Перейдите в раздел
Languages & Frameworks->PHP. - В секции
CLI Interpreterнажмите кнопку...справа. - В появившемся окне кликните на
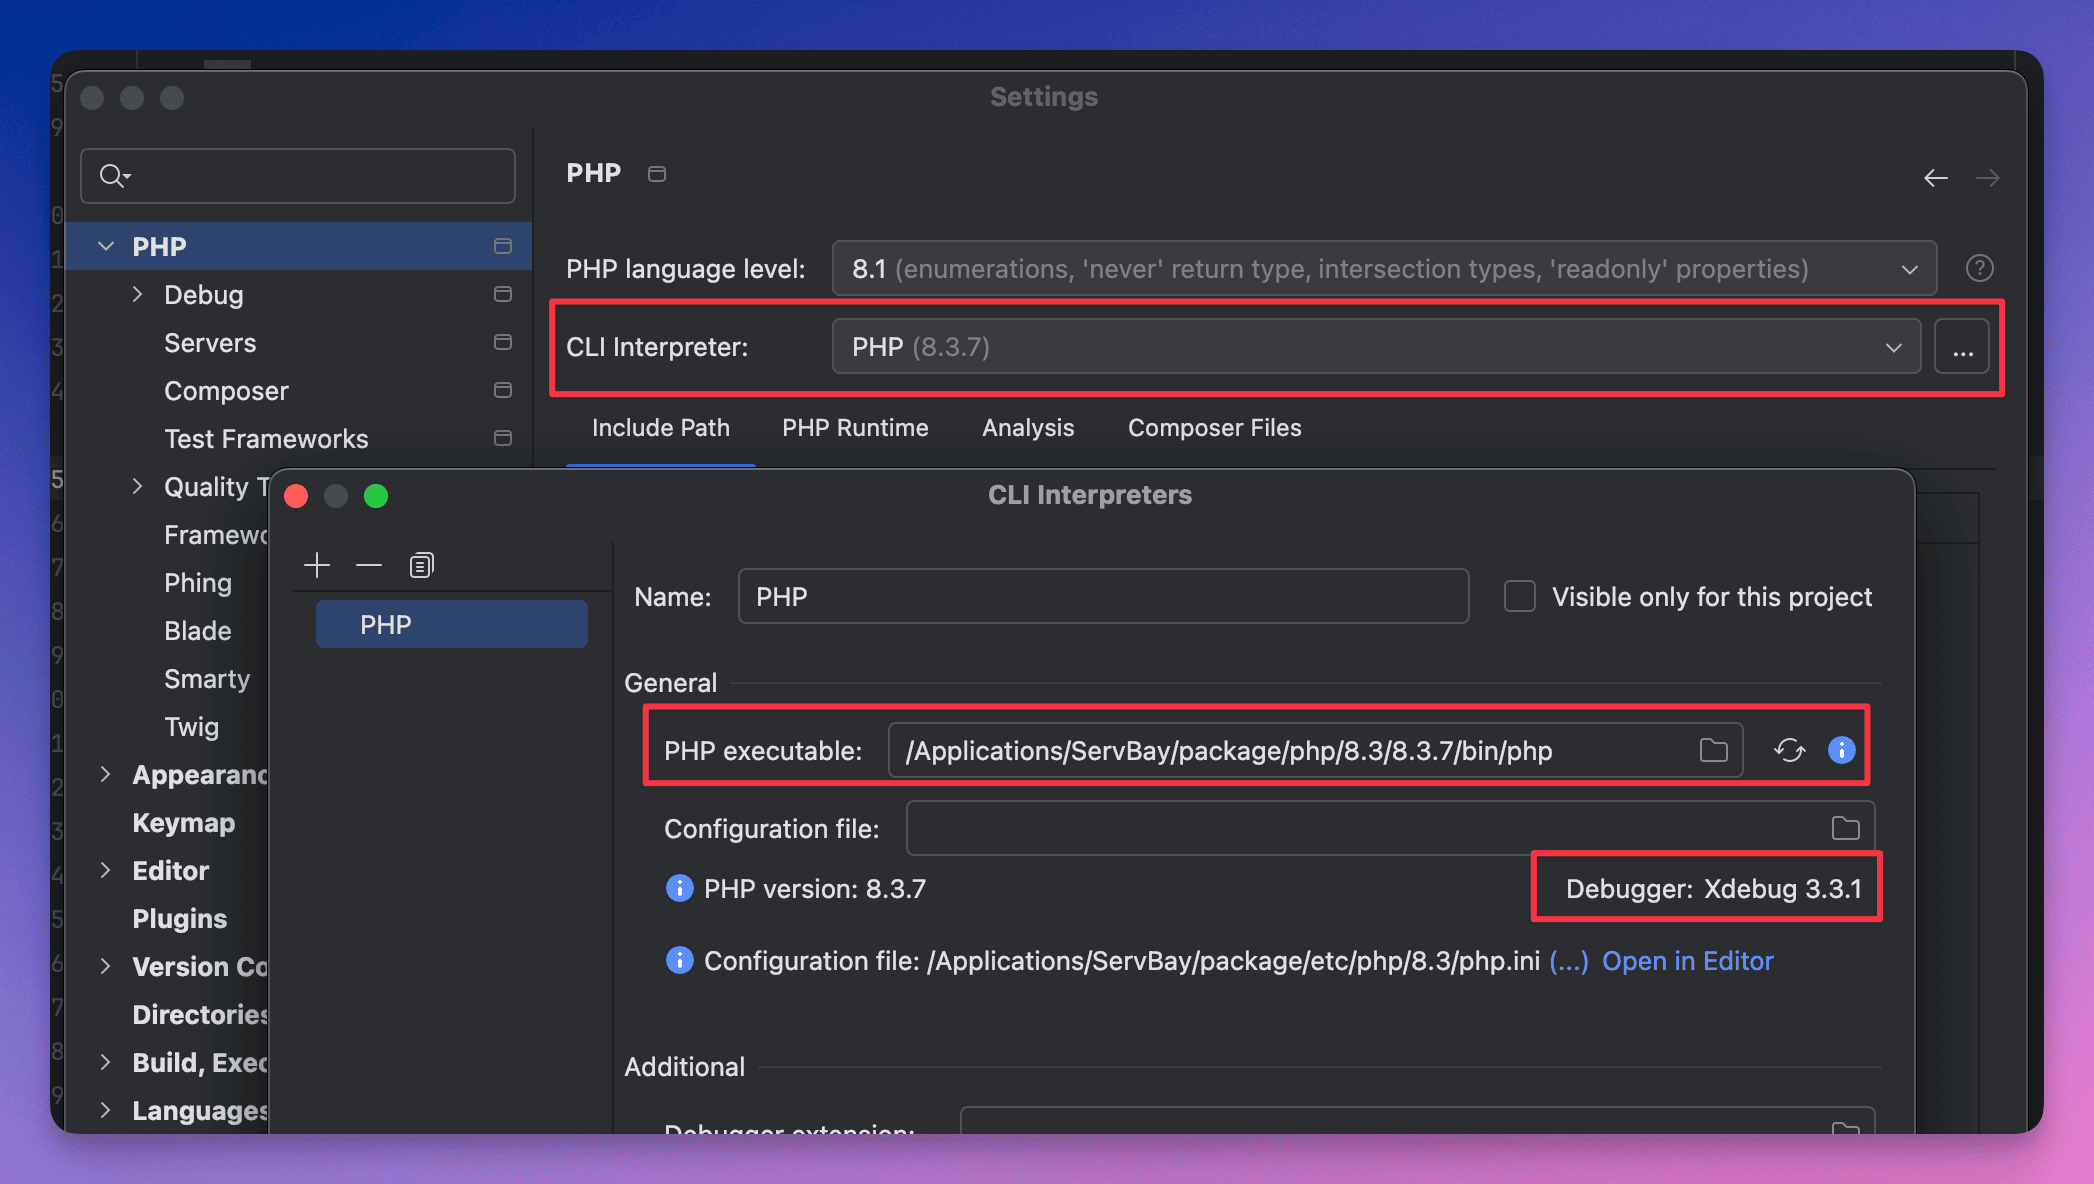
+, чтобы добавить новый локальный интерпретатор. - Укажите путь к исполняемому файлу PHP той версии, что использует ServBay, например
/Applications/ServBay/package/php/8.3/8.3.7/bin/php(учтите, что версия директории может отличаться; проверьте свою установку). - PHPStorm автоматически определит версию интерпретатора и подключённые расширения, включая Xdebug.
- Нажмите
OKдля сохранения.
 На иллюстрации: настройка CLI-интерпретатора ServBay в PHPStorm
- Перейдите в раздел
Настройте параметры отладки Xdebug:
- Перейдите в
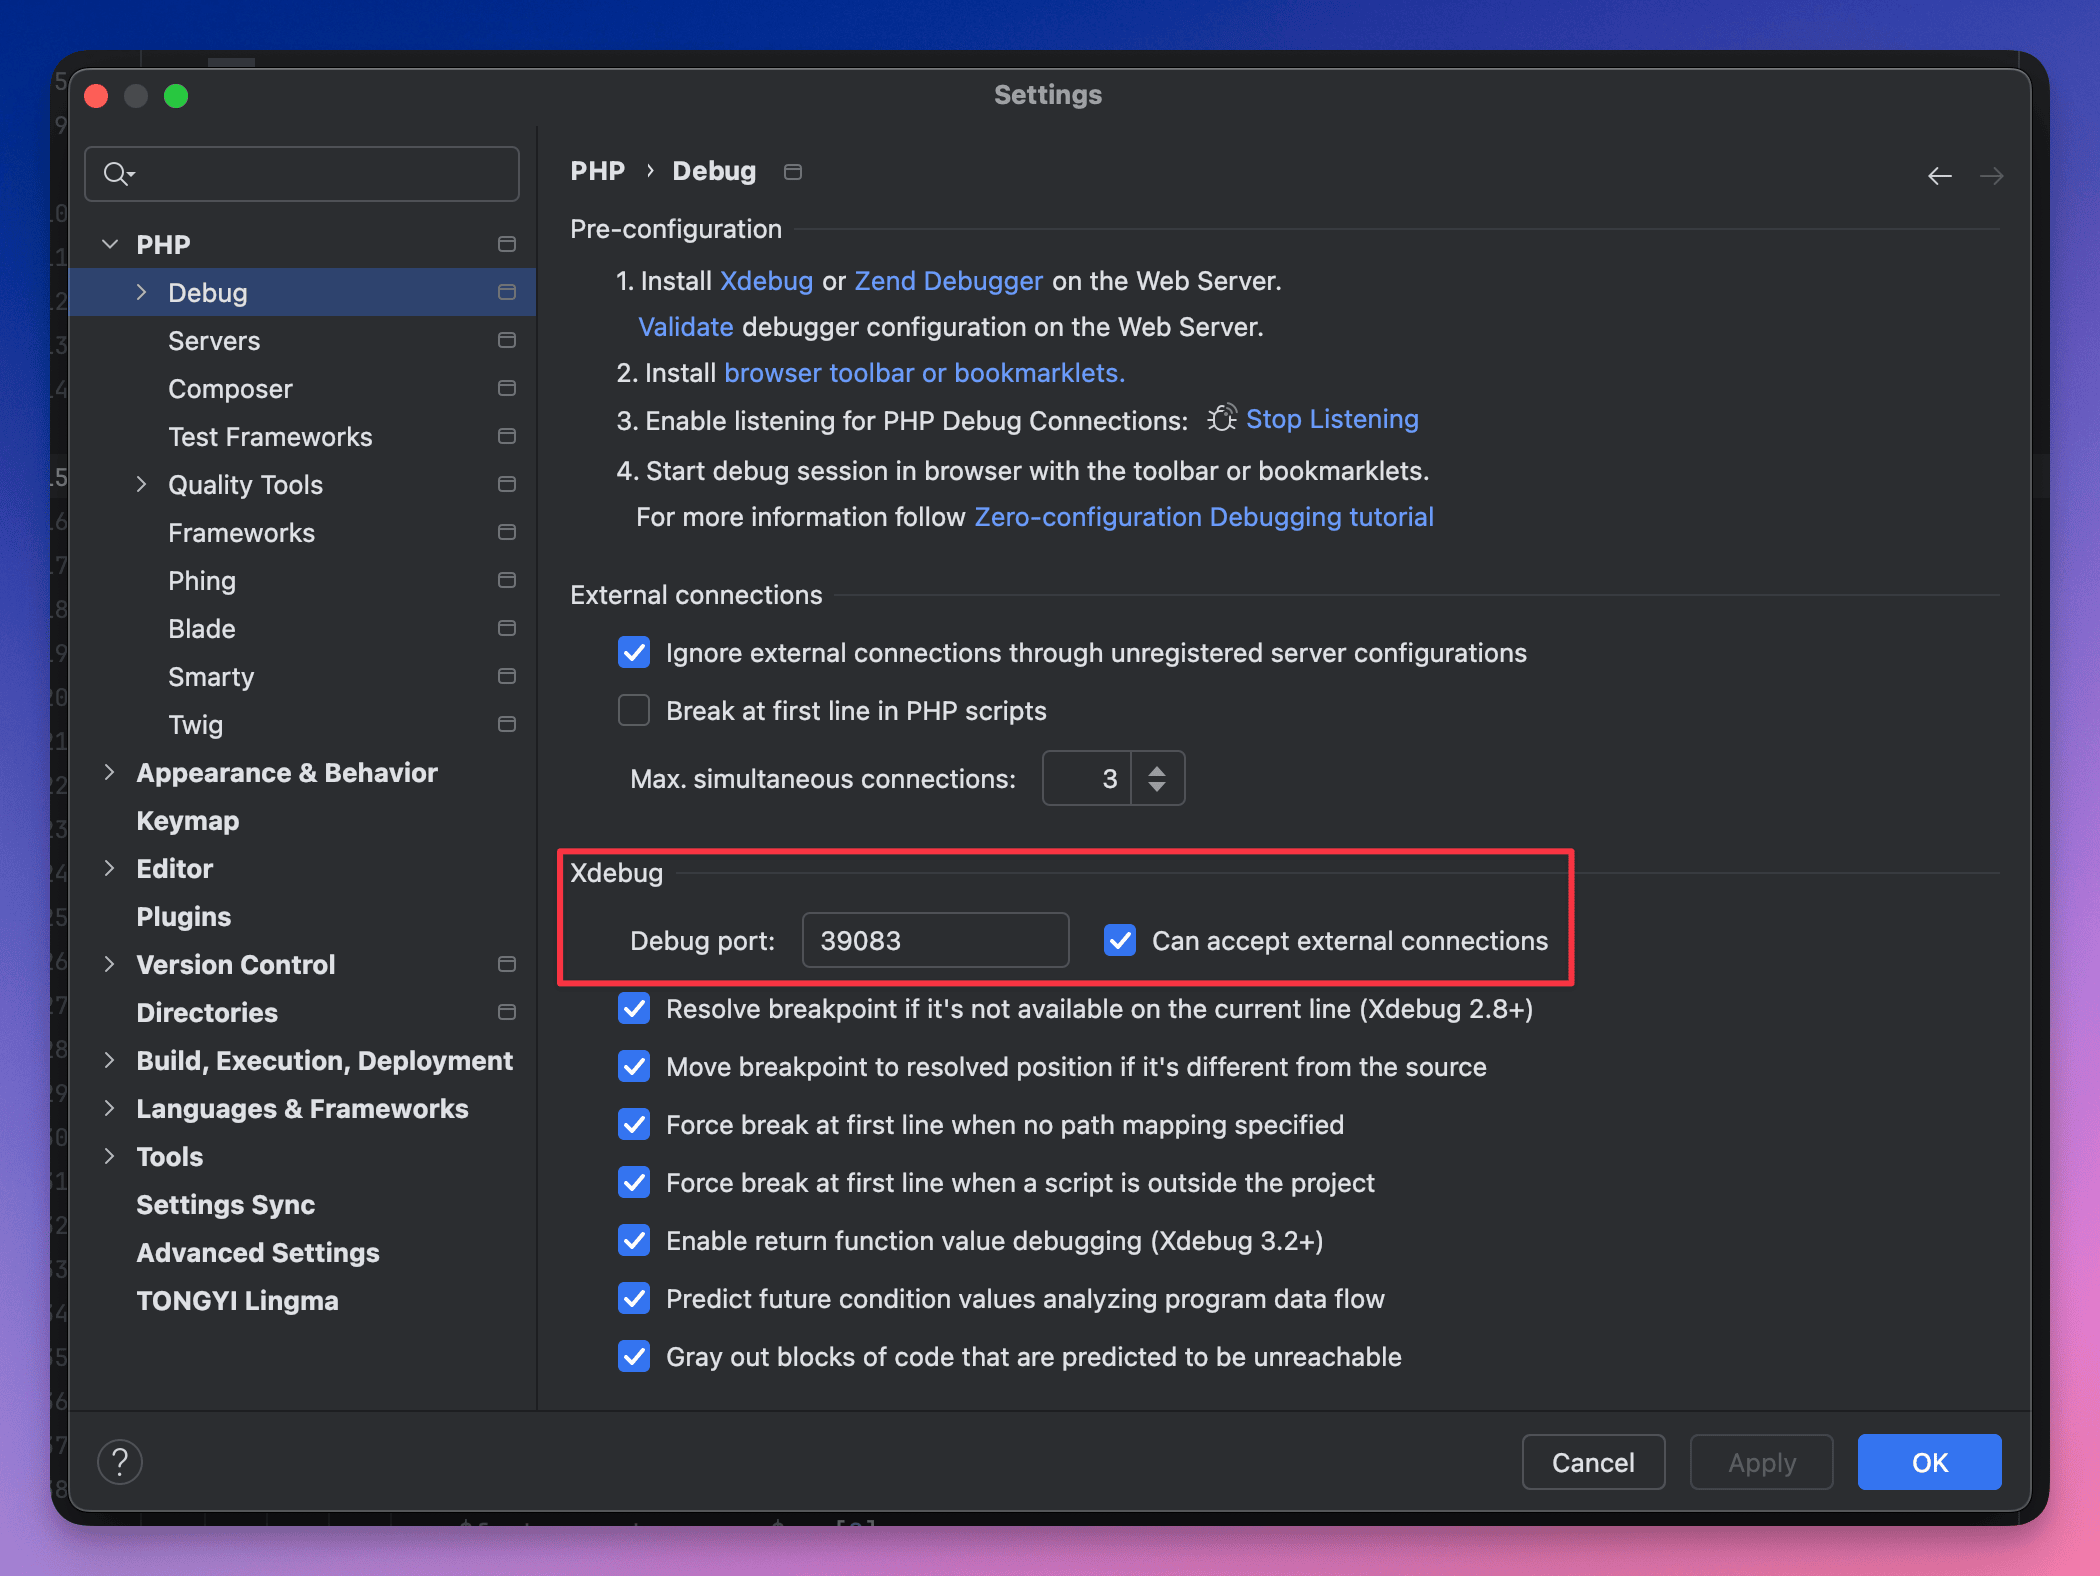
Languages & Frameworks->PHP->Debug. - В секции
XdebugукажитеDebug Port— порт для Xdebug для вашей версии PHP в ServBay (например, PHP 8.3 — это39083). Убедитесь, что этот порт совпадает со значением вxdebug.client_port. - Отметьте опцию
Can accept external connections. - После необходимости нажмите
Apply, затемOKдля сохранения.
 На иллюстрации: установка порта прослушивания Xdebug в PHPStorm
- Перейдите в
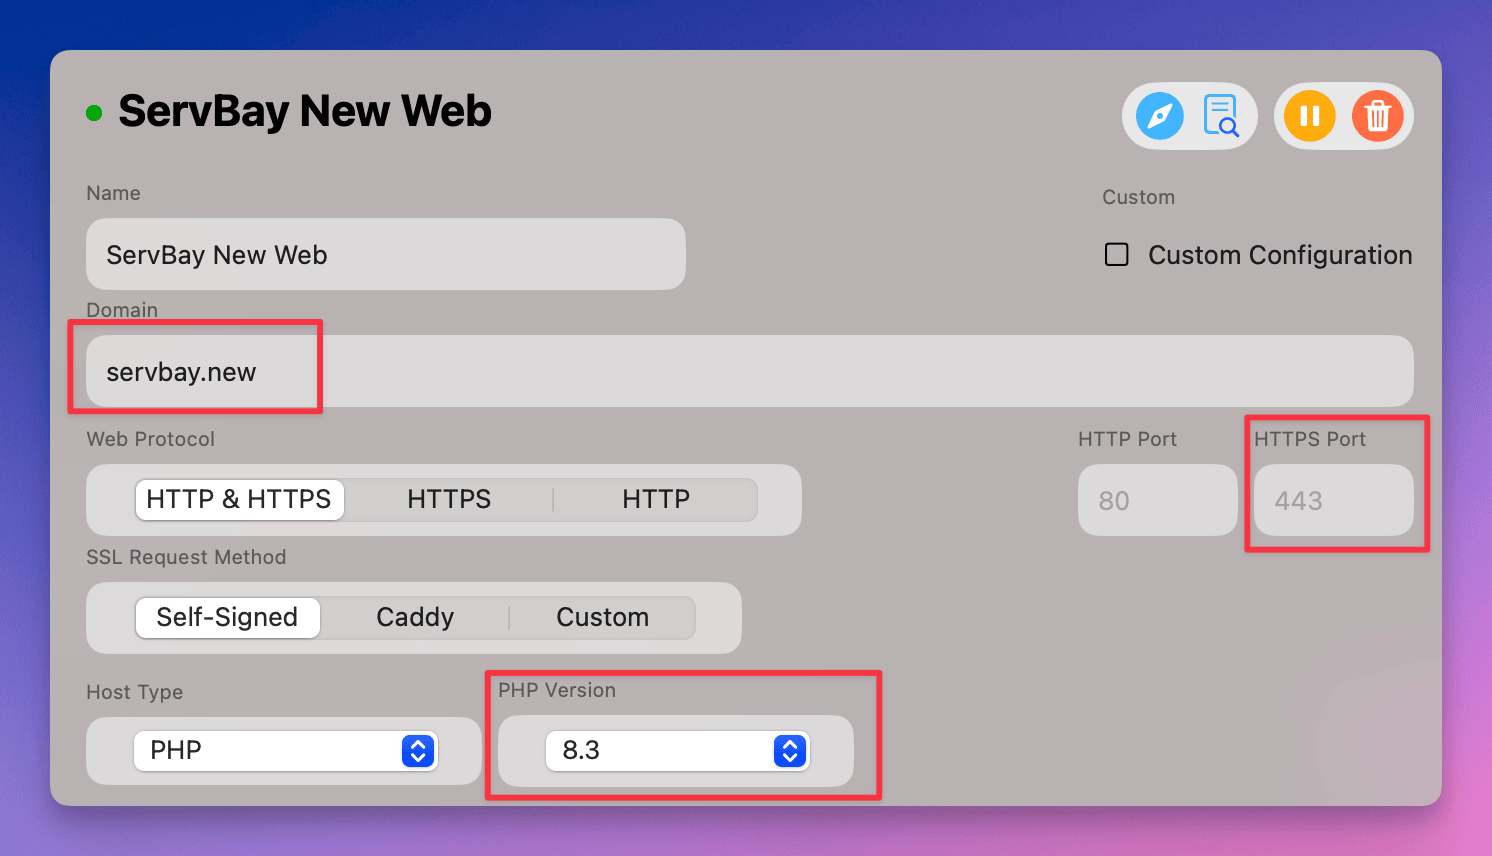
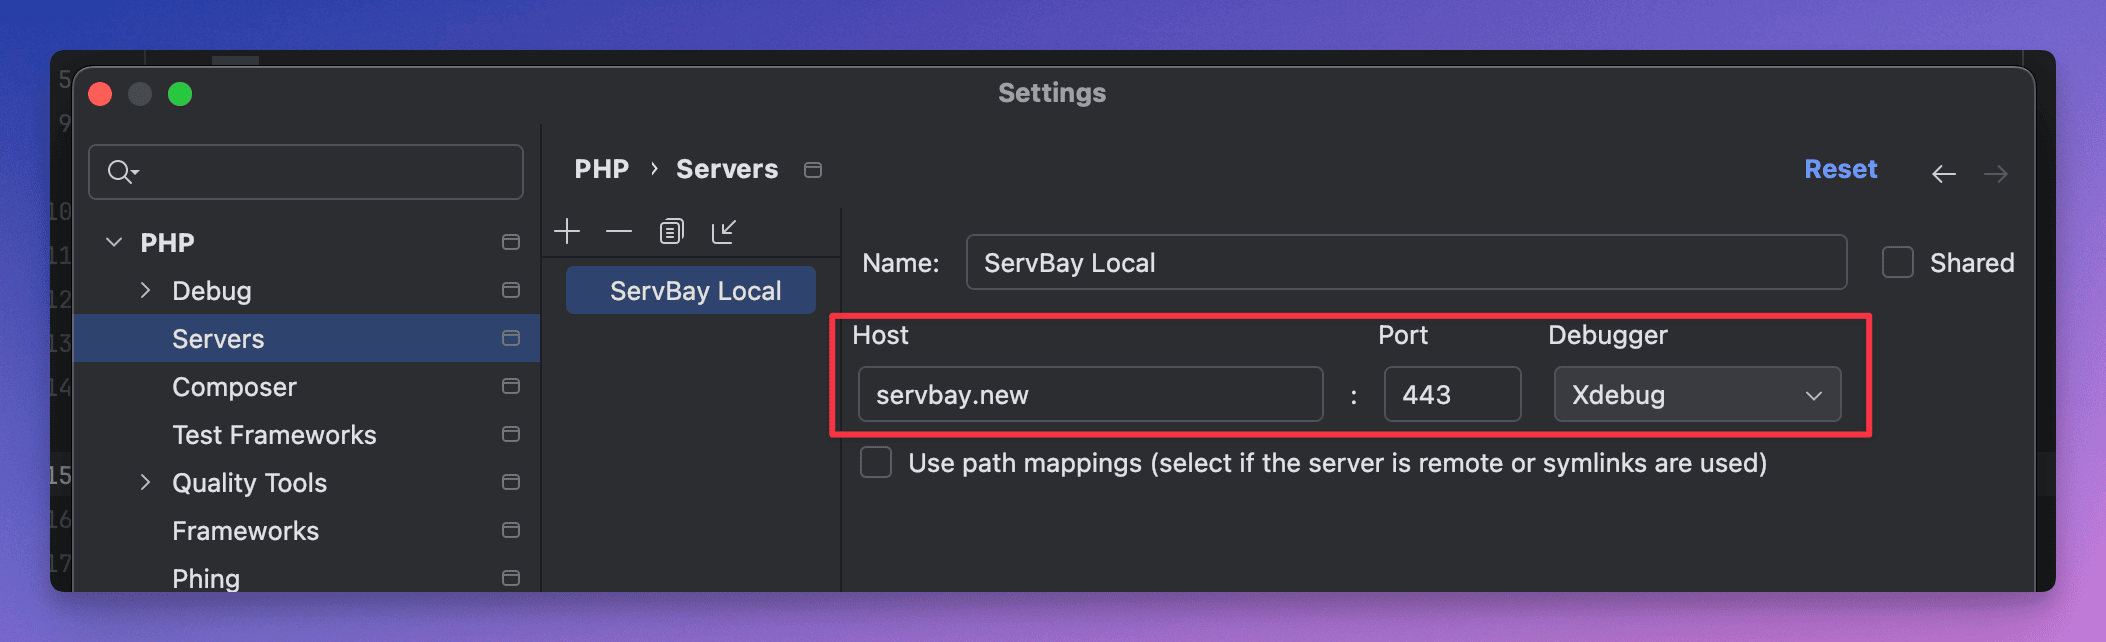
Настройте маппинг веб-серверов:
- Перейдите в
Languages & Frameworks->PHP->Servers. - Нажмите кнопку
+для добавления нового сервера. - Укажите имя сервера, например
ServBay Localhost. - Введите значение
Host— домен, который вы используете (например,servbay.demo). - Укажите порт — как правило, это
443(HTTPS) или80(HTTP). - Для опции
DebuggerвыберитеXdebug. - Отметьте галочку
Use path mappings. - Настройте маппинг между локальным путём проекта (
Absolute path to local source) и соответствующим путём на сервере (Absolute path on the server). Например, если проект хранится в/Applications/ServBay/www/myprojectи доступен по адресуhttps://servbay.demo/, то локальный путь/Applications/ServBay/www/myprojectдолжен быть сопоставлен с серверным/. Если проект открыт под адресом видаhttps://myproject.servbay.demo/, настройте маппинг аналогично — локальный путь на корень сервера/. Корректная настройка маппинга путей критична для работы Xdebug. - Нажмите
OKдля сохранения.
 На иллюстрации: настройка сервера и маппинга путей в PHPStorm
- Перейдите в
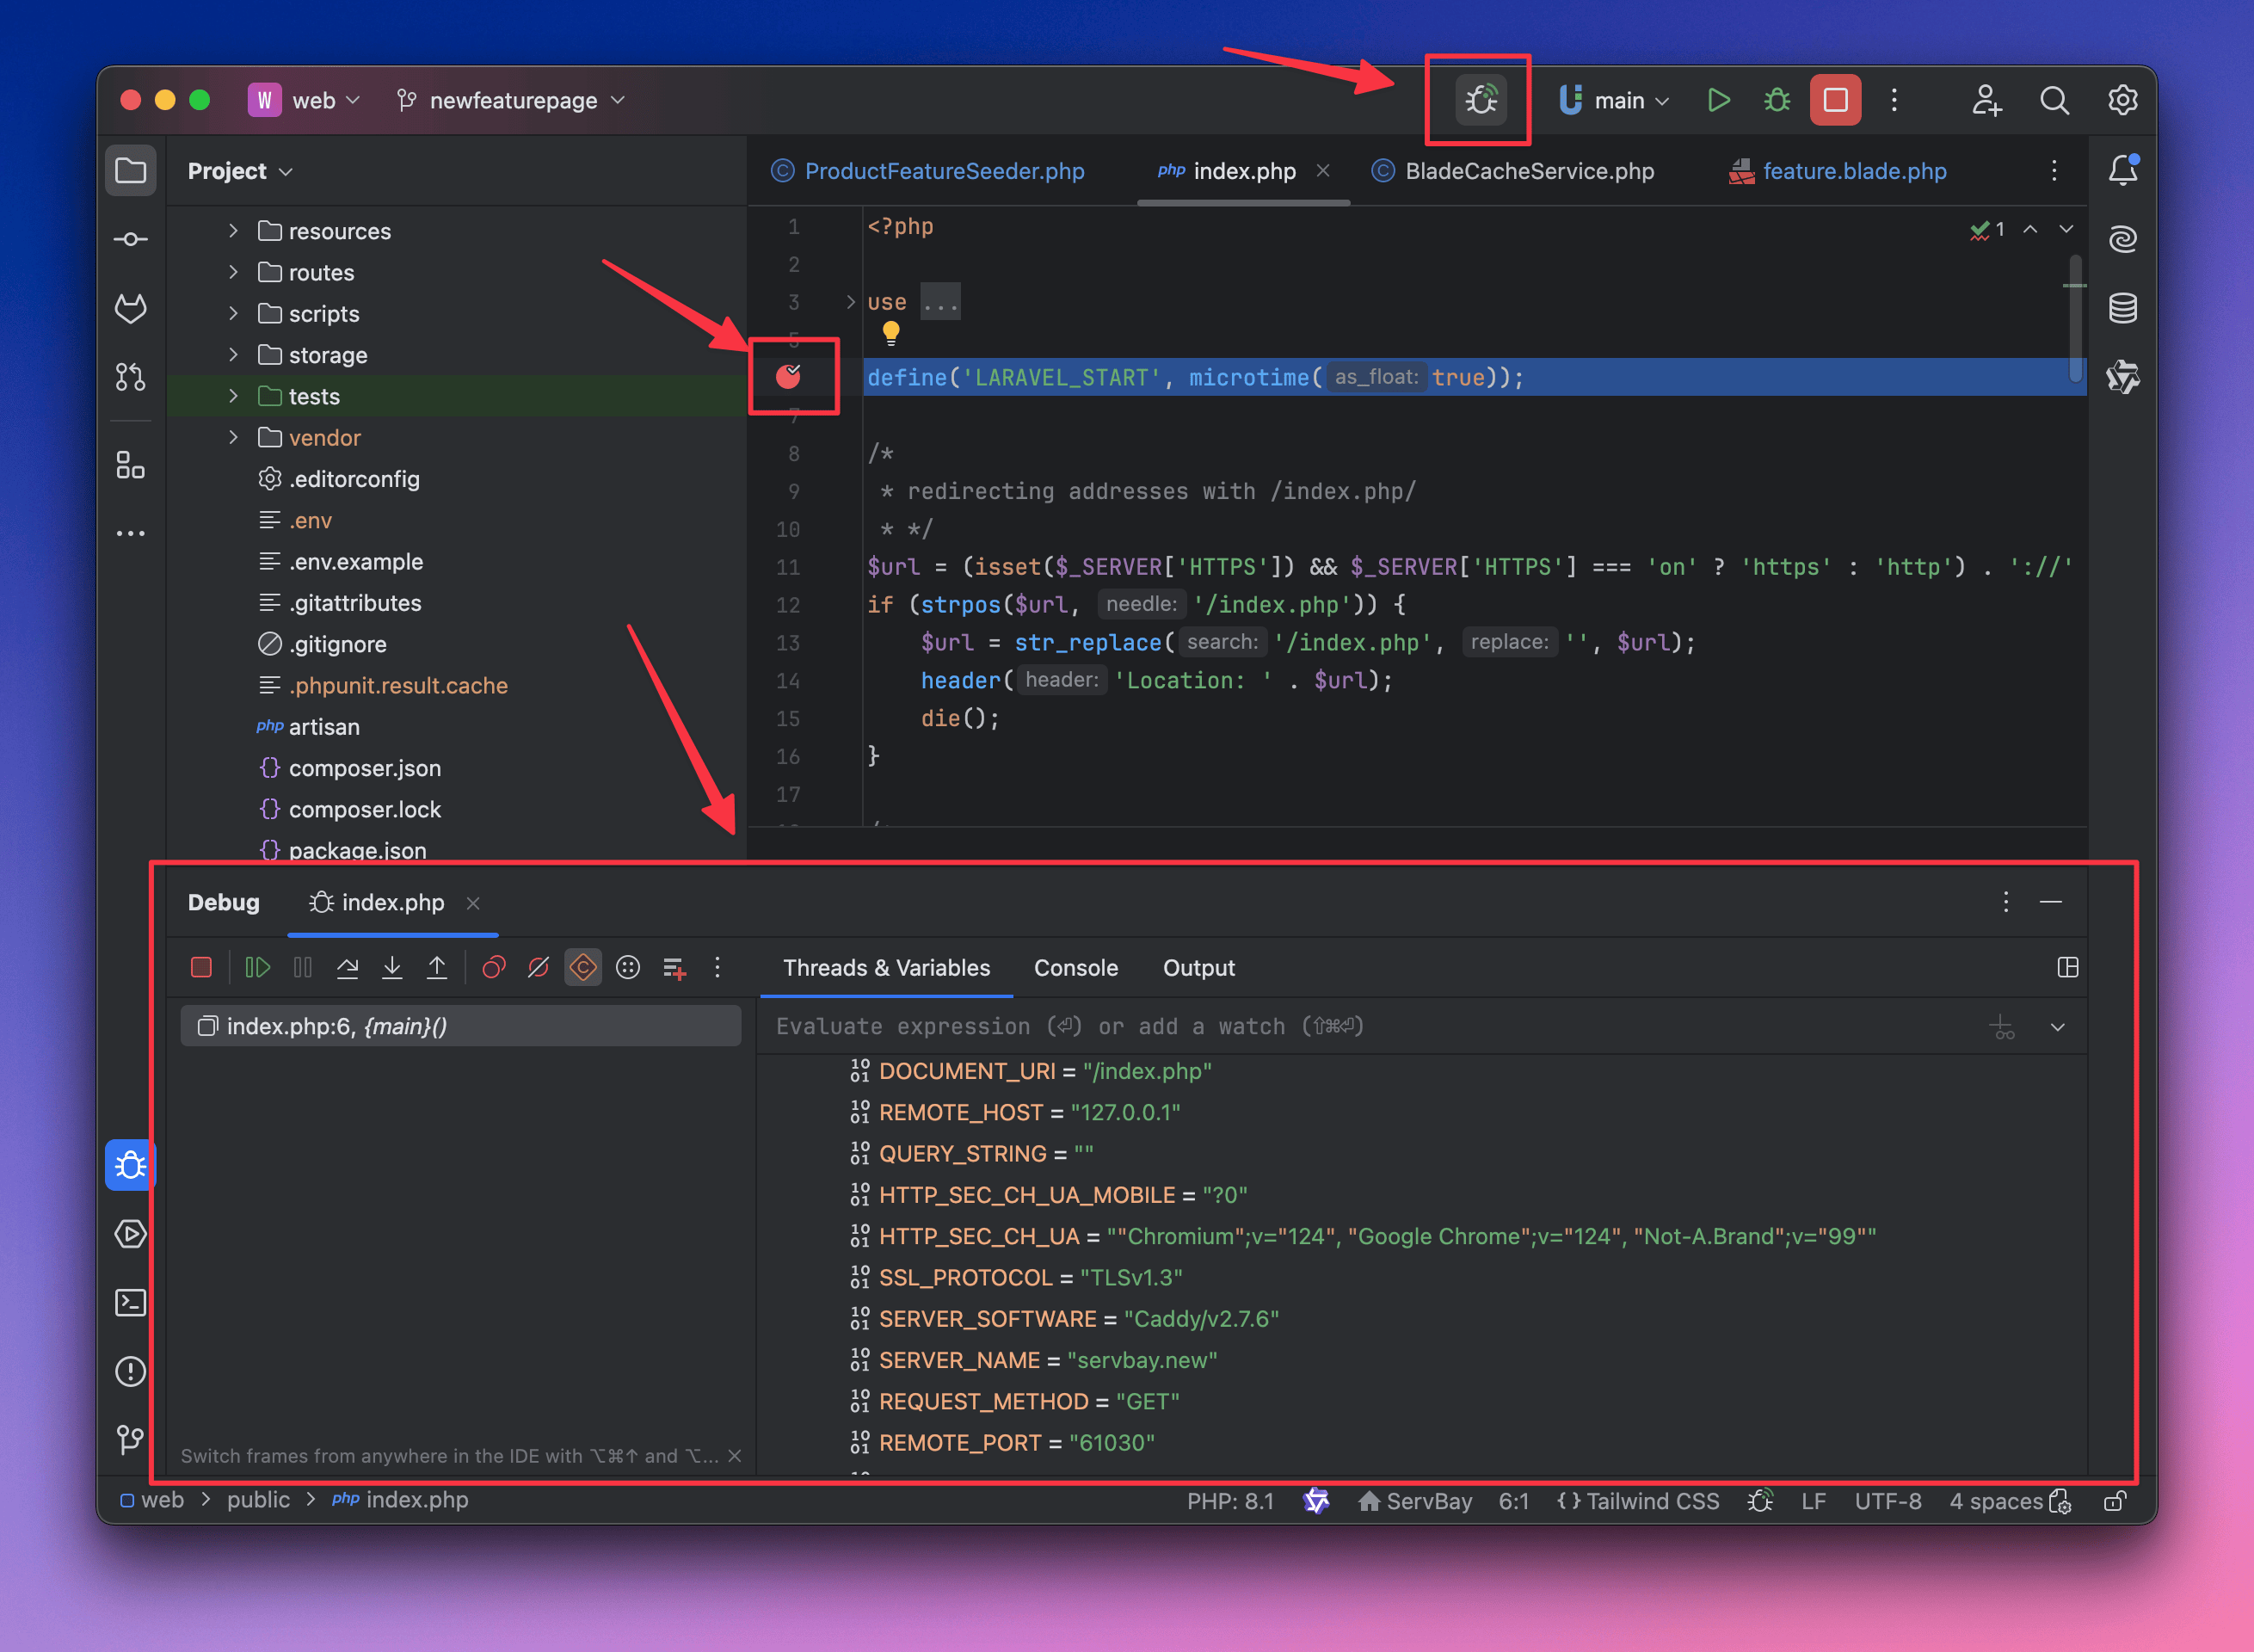
Запуск сессии отладки:
- Откройте проект PHP в PHPStorm.
- Установите точку останова, кликнув по пустому полю возле нужной строки кода (появится красный кружок).
- Нажмите кнопку
Start Listening for PHP Debug Connections(значок жука в верхней панели PHPStorm). Значок станет зелёным — это значит, что IDE ожидает соединения с Xdebug. - Откройте в браузере ваше PHP-приложение, например
https://servbay.demo/index.php. - Если настройка выполнена правильно, Xdebug автоматически подключится к PHPStorm и выполнит остановку на точке останова — теперь вы можете анализировать выполнение кода.
 На иллюстрации: запуск ожидания подключения Xdebug в PHPStorm
Настройка Xdebug в Visual Studio Code (VS Code)
VS Code — современный редактор кода, который отлично поддерживает Xdebug через расширения.
Установите расширение PHP Debug:
- Откройте VS Code.
- Переключитесь на вкладку расширений (
Ctrl+Shift+XилиCmd+Shift+X). - Введите в поиск "PHP Debug" и установите расширение от Felix Becker.
Настройте
launch.json:- Откройте папку с вашим PHP-проектом.
- Перейдите во вкладку "Run and Debug" (
Ctrl+Shift+DилиCmd+Shift+D). - Нажмите на значок шестерёнки вверху и выберите "PHP". Будет создан файл
launch.jsonв папке.vscodeв корне проекта. - Отредактируйте
launch.json. Обычно в нём уже есть конфигурация "Listen for Xdebug"; убедитесь, что параметрportсоответствует порту Xdebug для вашей версии PHP (например, PHP 8.3 —39083). - Настройте Path Mapping: Это ключевой шаг для отладки Xdebug в VS Code. В конфигурации
launch.jsonнайдите или добавьте разделpathMappings. Он сопоставляет путь проекта на сервере ServBay с локальным путём на рабочей машине.jsonПодкорректируйте{ "version": "0.2.0", "configurations": [ { "name": "Listen for Xdebug", "type": "php", "request": "launch", "port": 39083, // Измените порт в зависимости от вашей версии PHP "pathMappings": { // Сопоставление каталога сайта ServBay с локальным путём проекта // Например, если проект размещён в /Applications/ServBay/www/myproject // и доступен по https://servbay.demo/ — серверный корень '/' соответствует корню локального проекта "/": "${workspaceRoot}" // Аналогично для структуры с https://myproject.servbay.demo/ // "/": "${workspaceRoot}" } }, { "name": "Launch currently open script", "type": "php", "request": "launch", "program": "${file}", "cwd": "${fileDirname}", "port": 39083 // Измените порт в зависимости от вашей версии PHP } ] }pathMappingsисходя из структуры вашего проекта и конфигурации сайта в ServBay.${workspaceRoot}обычно указывает на корневую папку проекта, открытую в VS Code.
Запуск отладочной сессии:
- Откройте нужный файл PHP-проекта в VS Code.
- Установите точку останова, кликнув слева от строки кода (появится красный круг).
- Переключитесь на вкладку "Run and Debug" (
Ctrl+Shift+DилиCmd+Shift+D). - В выпадающем списке выберите конфигурацию "Listen for Xdebug".
- Нажмите зелёную кнопку запуска отладки. Строка состояния внизу сменит цвет на оранжевый — значит началось прослушивание Xdebug.
- В браузере перейдите к вашему приложению на PHP. При грамотной конфигурации Xdebug подключится к VS Code, и выполнение остановится на точке останова.
Часто задаваемые вопросы (FAQ)
Вопрос: Xdebug не отображается в выводе
phpinfo()?- Ответ: Проверьте, что модуль Xdebug активирован через GUI ServBay или вручную в файле
xdebug.ini. - Убедитесь, что вы перезапустили соответствующий процесс PHP.
- Проверьте путь к файлу
xdebug.iniи что строкаzend_extension = xdebug.soне закомментирована. - Изучите журналы ошибок ServBay (
/Applications/ServBay/logs/php/<version>/error.log) на наличие сообщений о сбоях при загрузке Xdebug.
- Ответ: Проверьте, что модуль Xdebug активирован через GUI ServBay или вручную в файле
Вопрос: Отладчик не останавливается на точках останова в IDE?
- Ответ: Проверьте, что ваша IDE слушает соединения Xdebug (значок жука в PHPStorm зелёный, статус-бар в VS Code оранжевый).
- Убедитесь, что порт Xdebug, указанный в настройках IDE, совпадает с параметром
xdebug.client_portв ServBay и стандартным портом вашей версии PHP. - Проверьте маппинг путей (Path Mapping) в настройках IDE — наиболее часто встречающаяся ошибка при конфигурировании.
- Изучите настройки брандмауэра, чтобы убедиться, что IDE не блокирует порты, используемые Xdebug (обычно из серии
390xx). - Если в
xdebug.iniиспользуетсяxdebug.start_with_request=trigger, убедитесь, что запрос содержит триггер (например, используйте расширение Xdebug helper в браузере или добавьте параметр URL?XDEBUG_TRIGGER=1).
Вопрос: Xdebug неожиданно разрывает соединение через некоторое время?
- Ответ: Проверьте параметры
xdebug.remote_autostartилиxdebug.start_with_requestв настройках Xdebug — если они всегда включены, это может провоцировать запуск отладки для каждого запроса. Рекомендуется использовать режимtrigger. - Ознакомьтесь с настройками таймаутов отладки в вашей IDE — иногда разрыв вызван ими.
- Ответ: Проверьте параметры
Заключение
ServBay с предустановленным Xdebug и простым процессом настройки существенно снижает порог входа для PHP-разработчиков. Используя интуитивно понятный GUI или ручное редактирование конфигурационных файлов, вы можете быстро активировать Xdebug для любой версии PHP в вашей среде ServBay. В паре с мощными инструментами отладки из PHPStorm или VS Code это позволяет добиться максимальной производительности, гибкости и качества PHP-разработки. Освоив совместную работу ServBay и Xdebug, вы получите надёжный и эффективный инструмент для локальной разработки на PHP.