Cómo habilitar y configurar el módulo Xdebug en ServBay
ServBay, como un potente entorno local para desarrollo web, integra de serie la herramienta de depuración y análisis Xdebug para PHP. Activar Xdebug puede mejorar notablemente la eficiencia en el desarrollo de aplicaciones PHP, facilitando la depuración del código, el análisis de rendimiento y la verificación de la cobertura de pruebas. En este artículo se detalla cómo habilitar y configurar Xdebug en ServBay y se explica cómo integrarlo con los entornos de desarrollo (IDE) más populares.
Descripción general del módulo Xdebug
Xdebug es una extensión avanzada de PHP diseñada para la depuración y análisis de código. ServBay incluye Xdebug preinstalado, eliminando la necesidad de que el desarrollador lo compile o instale manualmente, lo que hace que su activación y configuración sean muy sencillas.
Funciones principales de Xdebug
- Depuración con puntos de interrupción: Permite establecer breakpoints en líneas específicas del código, pausando la ejecución en esos puntos y permitiendo al desarrollador inspeccionar variables, la pila de llamadas, etc., y ejecutar el código paso a paso.
- Seguimiento paso a paso: Soporta la ejecución línea por línea (Step Over), entrar en funciones (Step Into) y salir de ellas (Step Out), facilitando el seguimiento del flujo del programa.
- Monitoreo de variables: Visualización en tiempo real de valores de variables locales y globales durante la depuración.
- Rastreo de la pila: Proporciona información detallada sobre la pila de llamadas cuando ocurren errores o excepciones, ayudando a localizar rápidamente el origen del problema.
- Análisis de rendimiento (Profiling): Genera informes de ejecución para identificar cuellos de botella en el rendimiento del código.
- Cobertura de código: Permite medir qué porcentaje de código ha sido probado, ayudando a evaluar la efectividad de los tests.
Versiones integradas de Xdebug y mapeo de puertos en ServBay
ServBay instala previamente el módulo de Xdebug correspondiente para cada versión de PHP. Es importante notar que el puerto de escucha de Xdebug es independiente para cada versión de PHP, habitualmente relacionado con su número de versión. Esto es clave para la configuración del depurador en el IDE.
| Versión de PHP | Versión Xdebug preinstalada | Puerto Xdebug por defecto |
|---|---|---|
| PHP 5.6 | Xdebug 2.5.5 | 39056 |
| PHP 7.0 | Xdebug 2.5.5 | 39070 |
| PHP 7.1 | Xdebug 2.5.5 | 39071 |
| PHP 7.2 | Xdebug 3.1.6 | 39072 |
| PHP 7.3 | Xdebug 3.1.6 | 39073 |
| PHP 7.4 | Xdebug 3.1.6 | 39074 |
| PHP 8.0 | Xdebug 3.3.1 | 39080 |
| PHP 8.1 | Xdebug 3.4.0 | 39081 |
| PHP 8.2 | Xdebug 3.4.0 | 39082 |
| PHP 8.3 | Xdebug 3.4.0 | 39083 |
| PHP 8.4 | Xdebug 3.4.0 | 39084 |
| PHP 8.5 | Xdebug 3.4.0 | 39085 |
Regla de puertos
La regla para el puerto por defecto de Xdebug es 39000 + el subnúmero de versión de PHP. Por ejemplo, PHP 8.3 usará el puerto 39000 + 83 = 39083 y PHP 7.4 usará el puerto 39000 + 74 = 39074. Comprender esta regla te ayudará a identificar rápidamente el puerto Xdebug para cada versión de PHP.
Cómo habilitar el módulo Xdebug
Activar Xdebug en ServBay es muy sencillo, especialmente utilizando su interfaz gráfica (GUI). También puedes hacerlo editando manualmente el archivo de configuración.
Habilitar Xdebug a través de la GUI de ServBay
Este es el método más rápido y sencillo.
- Abre la interfaz de la aplicación ServBay.
- En la barra de navegación izquierda, selecciona
Lenguajes(Languages). - Expande la sección de
PHPy localiza la versión de PHP para la que deseas habilitar Xdebug (por ejemplo,PHP 8.3). - Haz clic en el botón de
Extensionescorrespondiente a esa versión. - En la lista de extensiones que aparece, encuentra el módulo
Xdebug. - Activa Xdebug utilizando el interruptor junto a su nombre.
- Modifica los parámetros según sea necesario.
- Haz clic en el botón
Guardaren la parte inferior de la interfaz. - ServBay reiniciará automáticamente el proceso PHP y cargará el módulo.
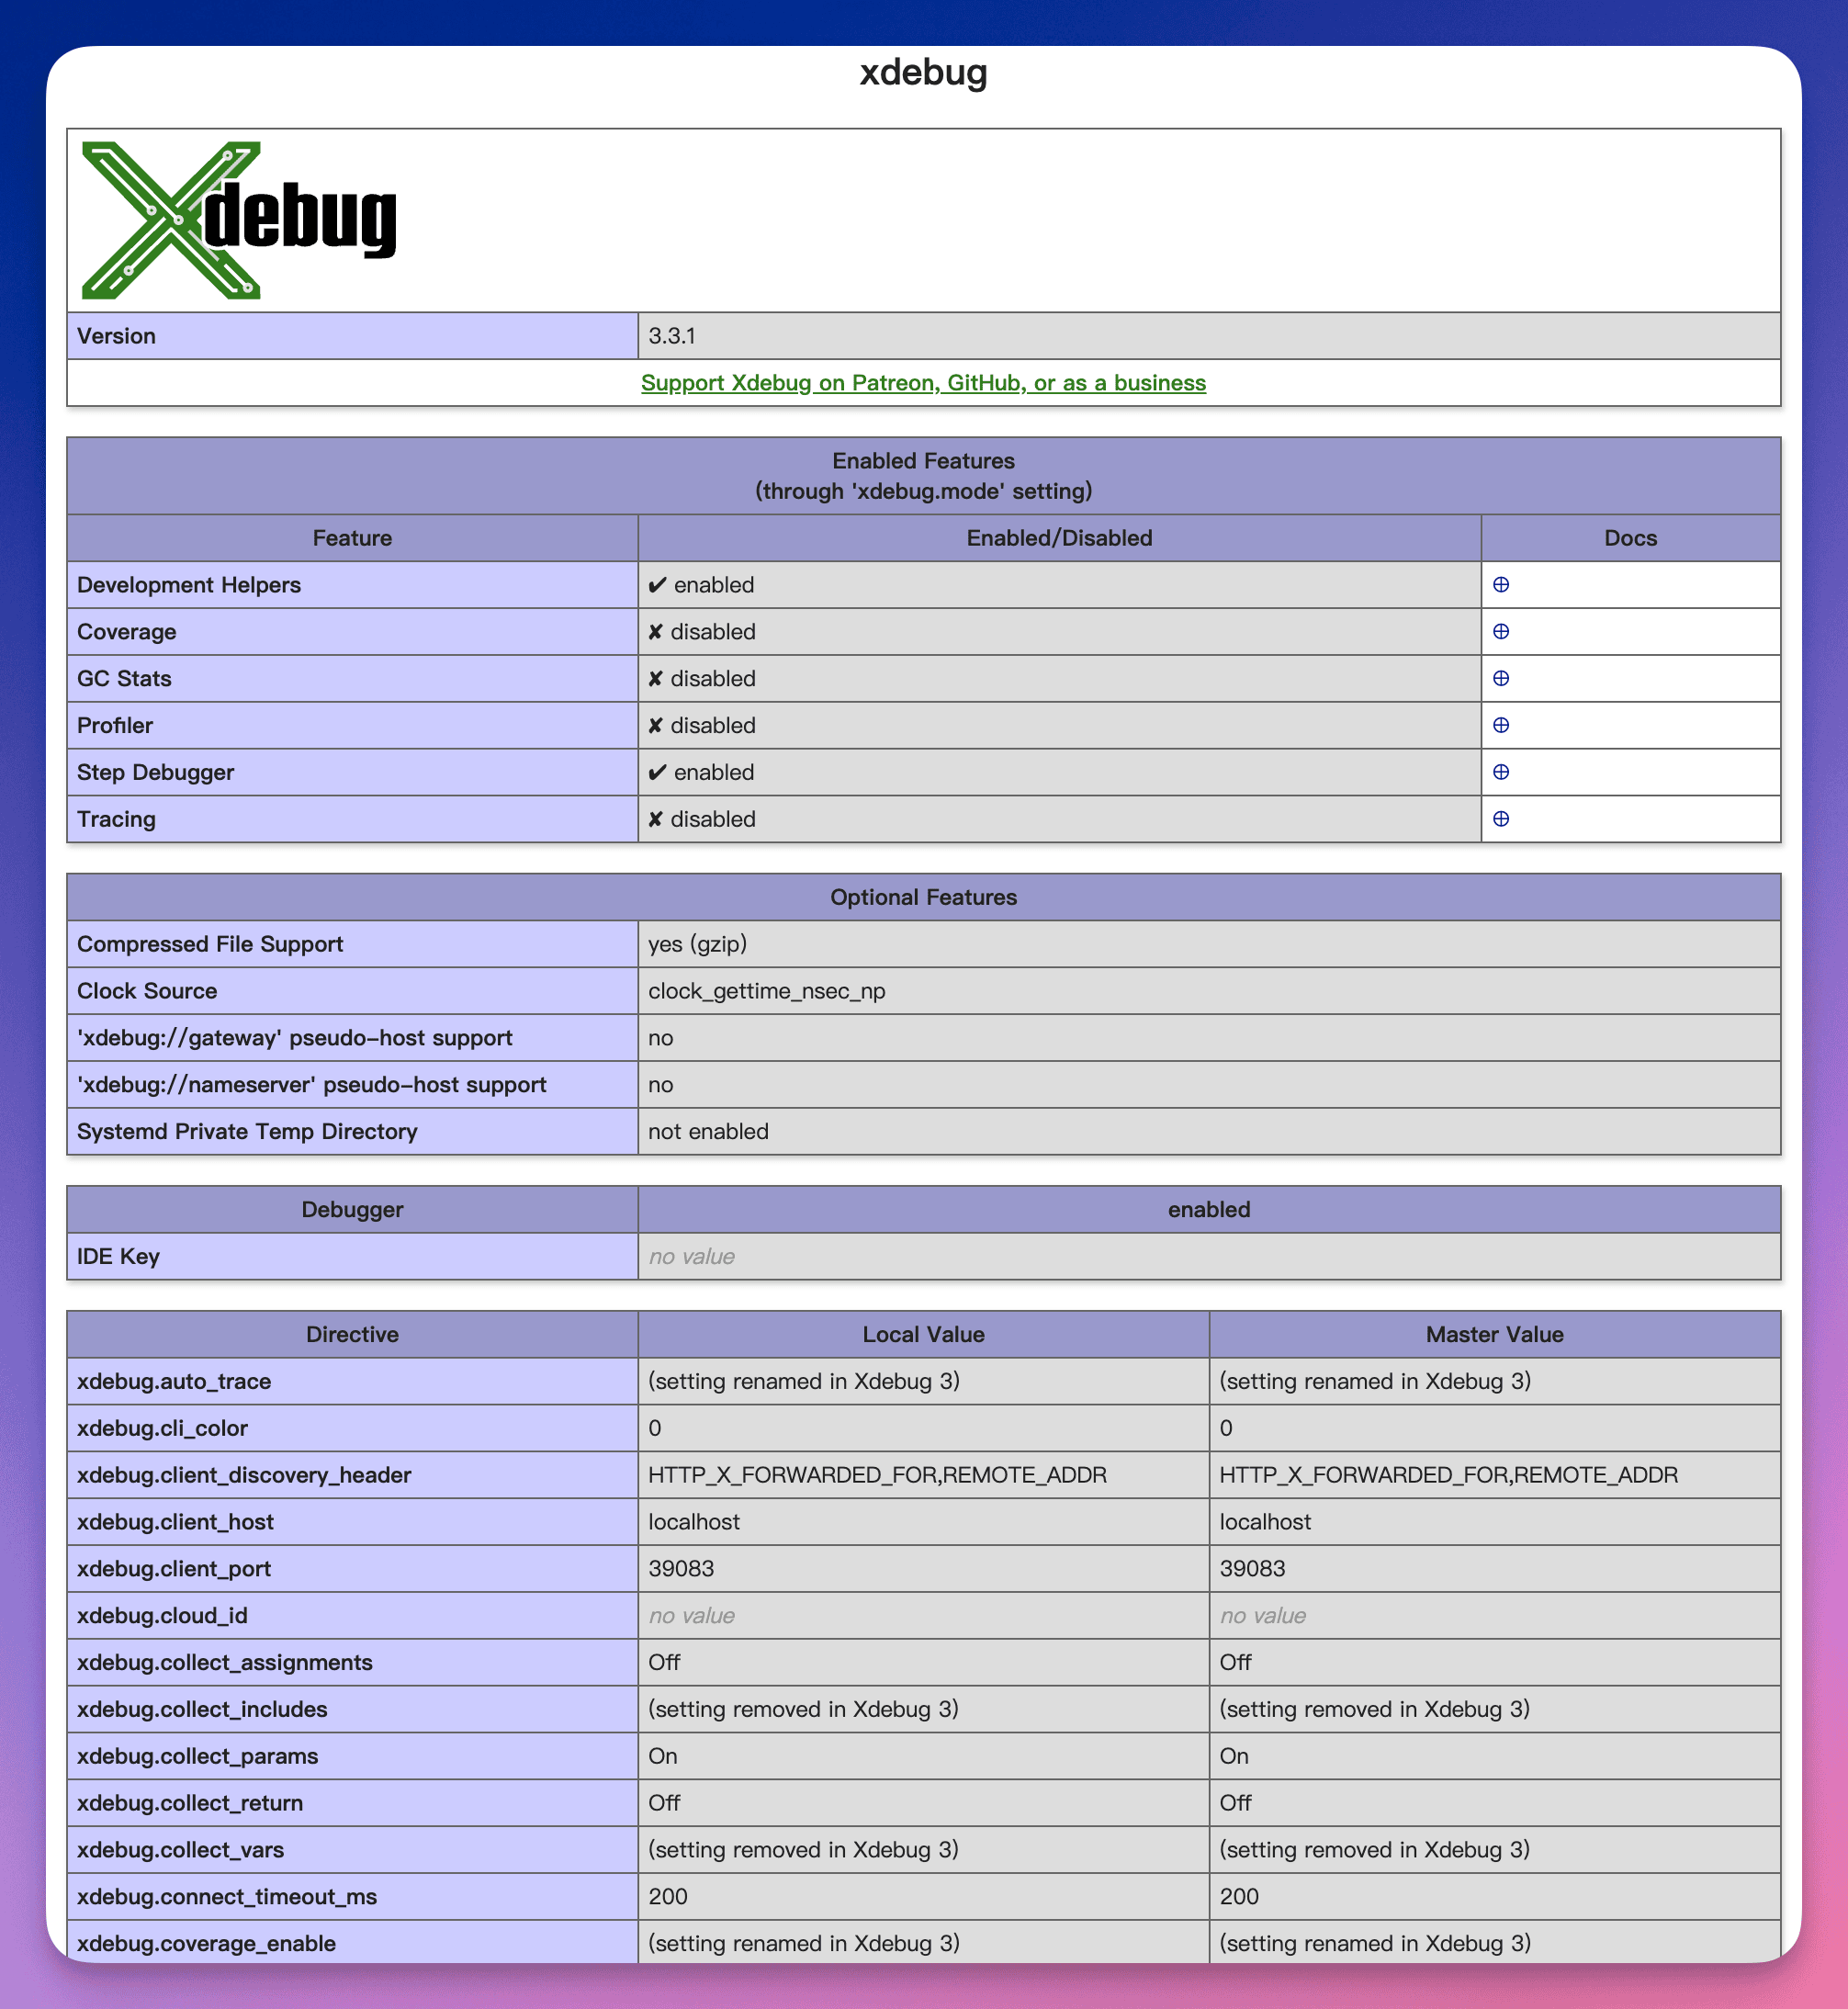 Ilustración: Activación de Xdebug en Extensiones
Comprobar si el módulo Xdebug se ha cargado correctamente
La forma más fiable de verificarlo es utilizando la función phpinfo() para consultar la configuración de PHP.
- Crea un archivo PHP sencillo (por ejemplo,
phpinfo.php) en el directorio raíz de tu web de ServBay (por defecto/Applications/ServBay/www). - Añade el siguiente contenido al archivo:php
<?php phpinfo(); ?> - Accede al archivo desde el navegador, por ejemplo
https://servbay.demo/phpinfo.php(reemplazaservbay.demopor el dominio que hayas configurado en ServBay). - Busca "Xdebug" en la página de salida de
phpinfo. Si el módulo está correctamente cargado, verás una sección específica dedicada a Xdebug con la versión y la configuración de la extensión.
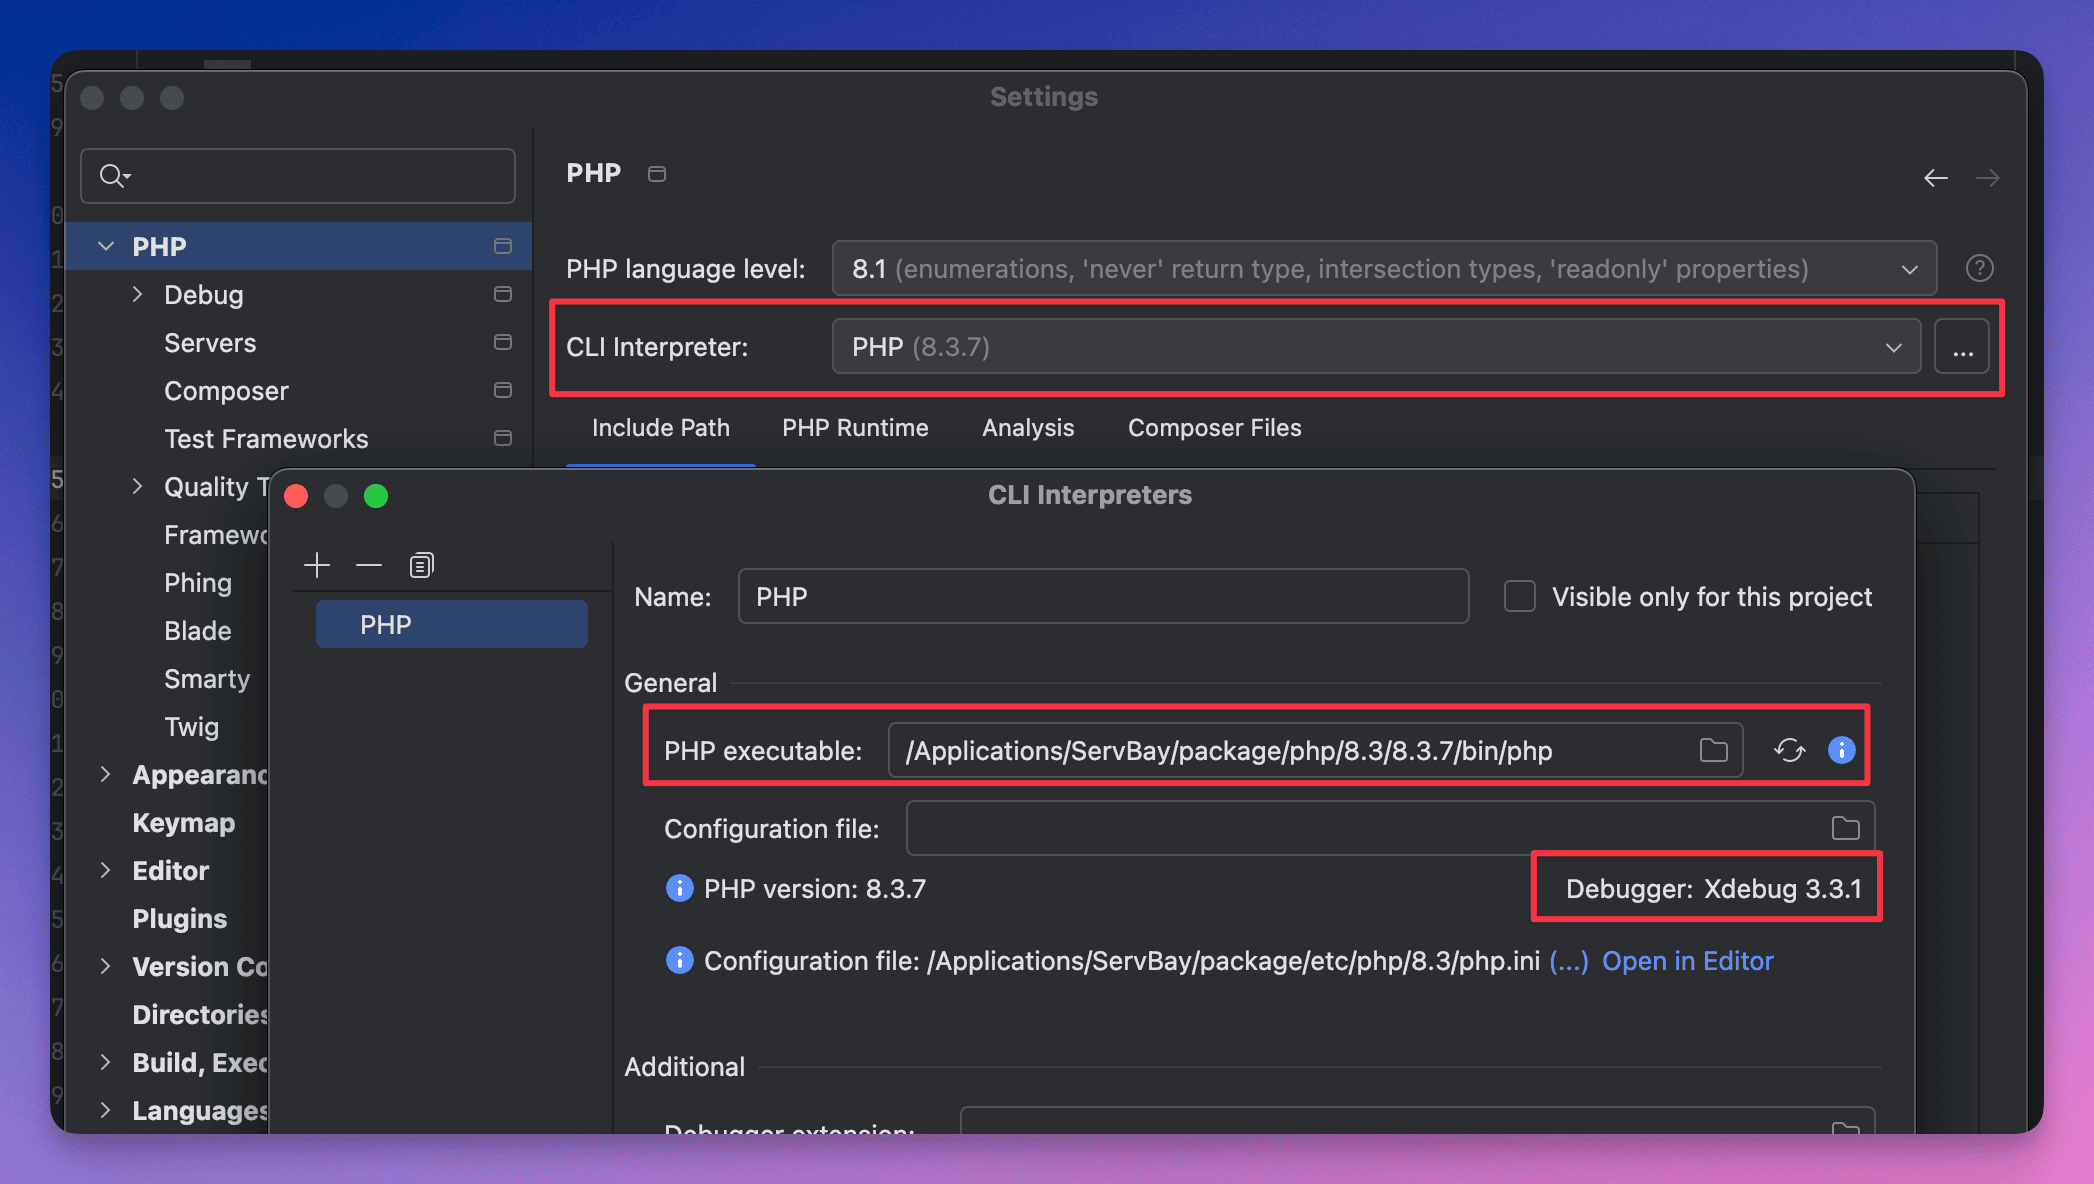 Ilustración: Localizando información de Xdebug en la salida de phpinfo
Configuración de Xdebug en el IDE para la depuración
Habilitar Xdebug es solo el primer paso: para depurar con breakpoints desde el IDE debes configurar el intérprete de PHP, el depurador y el mapeo de servidores correctamente en tu editor. A continuación se explica cómo hacerlo en PHPStorm y Visual Studio Code (VS Code).
Configuración de Xdebug en PHPStorm
PHPStorm ofrece una integración excelente con Xdebug.
Abre la configuración de PHPStorm: Inicia PHPStorm y navega hasta el menú
File->Settings(Windows/Linux) oPHPStorm->Preferences(macOS).Configura el intérprete CLI de PHP:
- Ve a
Languages & Frameworks->PHP. - En el apartado
CLI Interpreter, haz clic en...a la derecha. - En la ventana emergente, haz clic en el botón
+para añadir un nuevo intérprete local. - Selecciona la ruta del ejecutable PHP correspondiente en ServBay (por ejemplo,
/Applications/ServBay/package/php/8.3/8.3.7/bin/php, ajusta según tu versión y ruta de instalación de ServBay). - PHPStorm detectará automáticamente la versión y extensiones, incluyendo Xdebug.
- Haz clic en
OKpara guardar la configuración.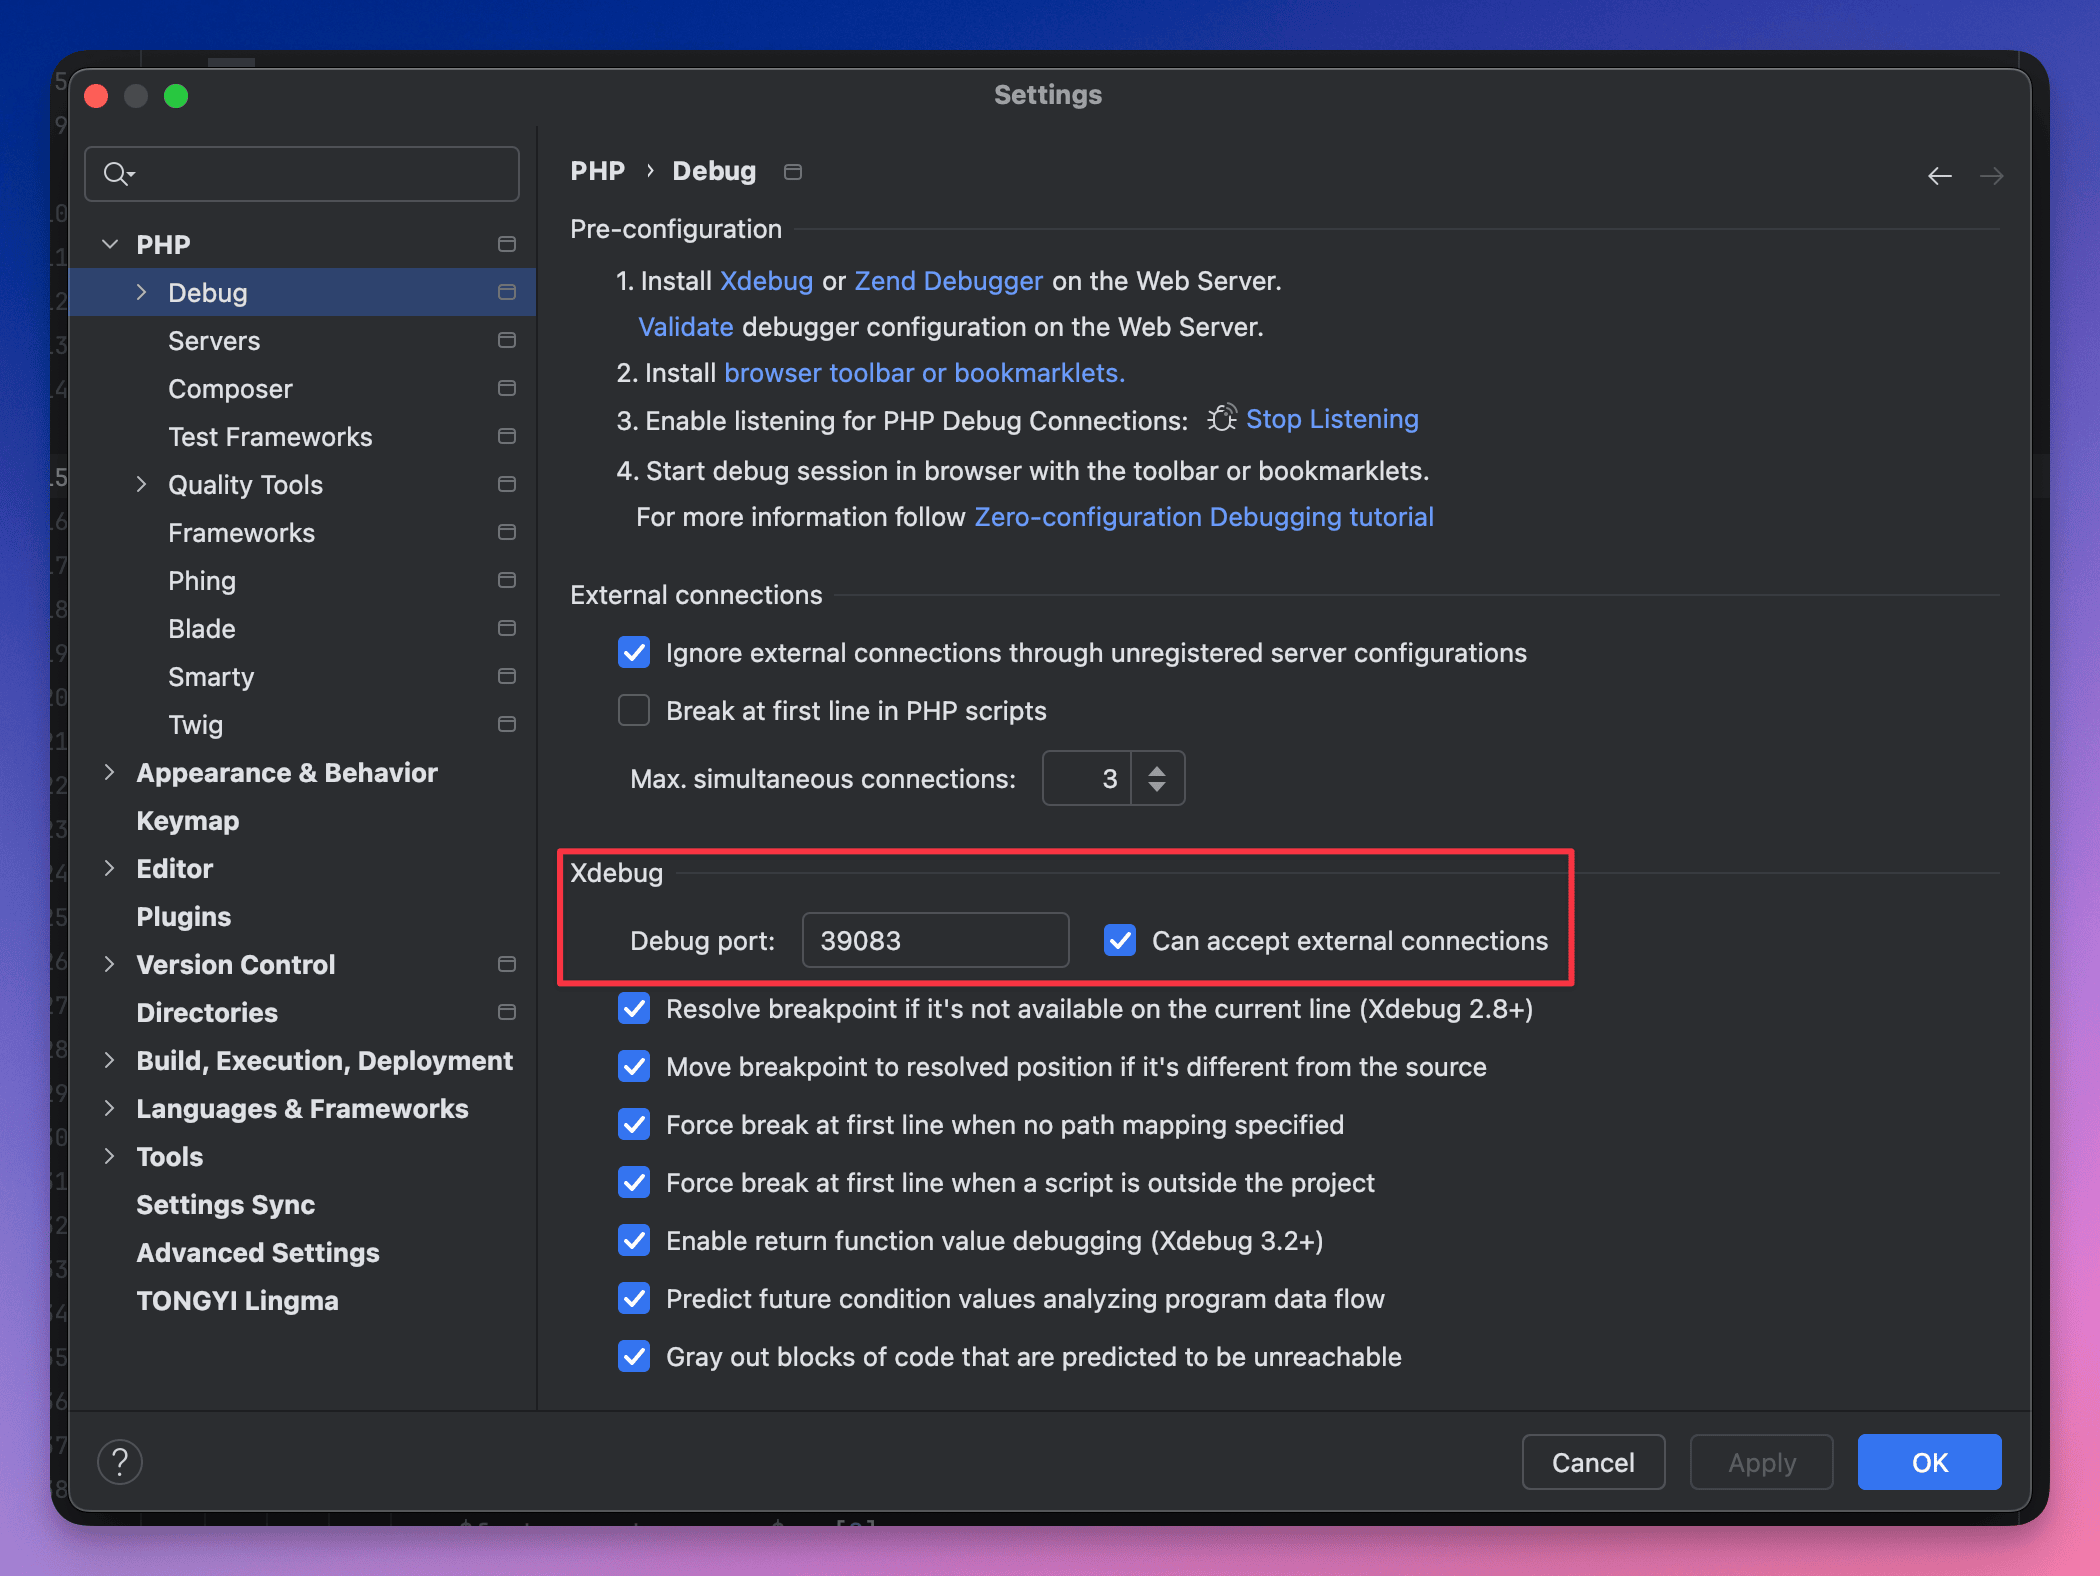 Ilustración: Configuración del intérprete CLI PHP en PHPStorm
- Ve a
Configura los parámetros de depuración de Xdebug:
- Dirígete a
Languages & Frameworks->PHP->Debug. - En la sección de
Xdebug, establece elPuerto de depuraciónal puerto correspondiente a la versión de PHP que estás usando en ServBay (por ejemplo,39083para PHP 8.3). Asegúrate de que este puerto coincida con el valor dexdebug.client_portde tu configuración. - Marca la opción
Can accept external connections. - Haz clic en
Applyy luego enOKpara guardar.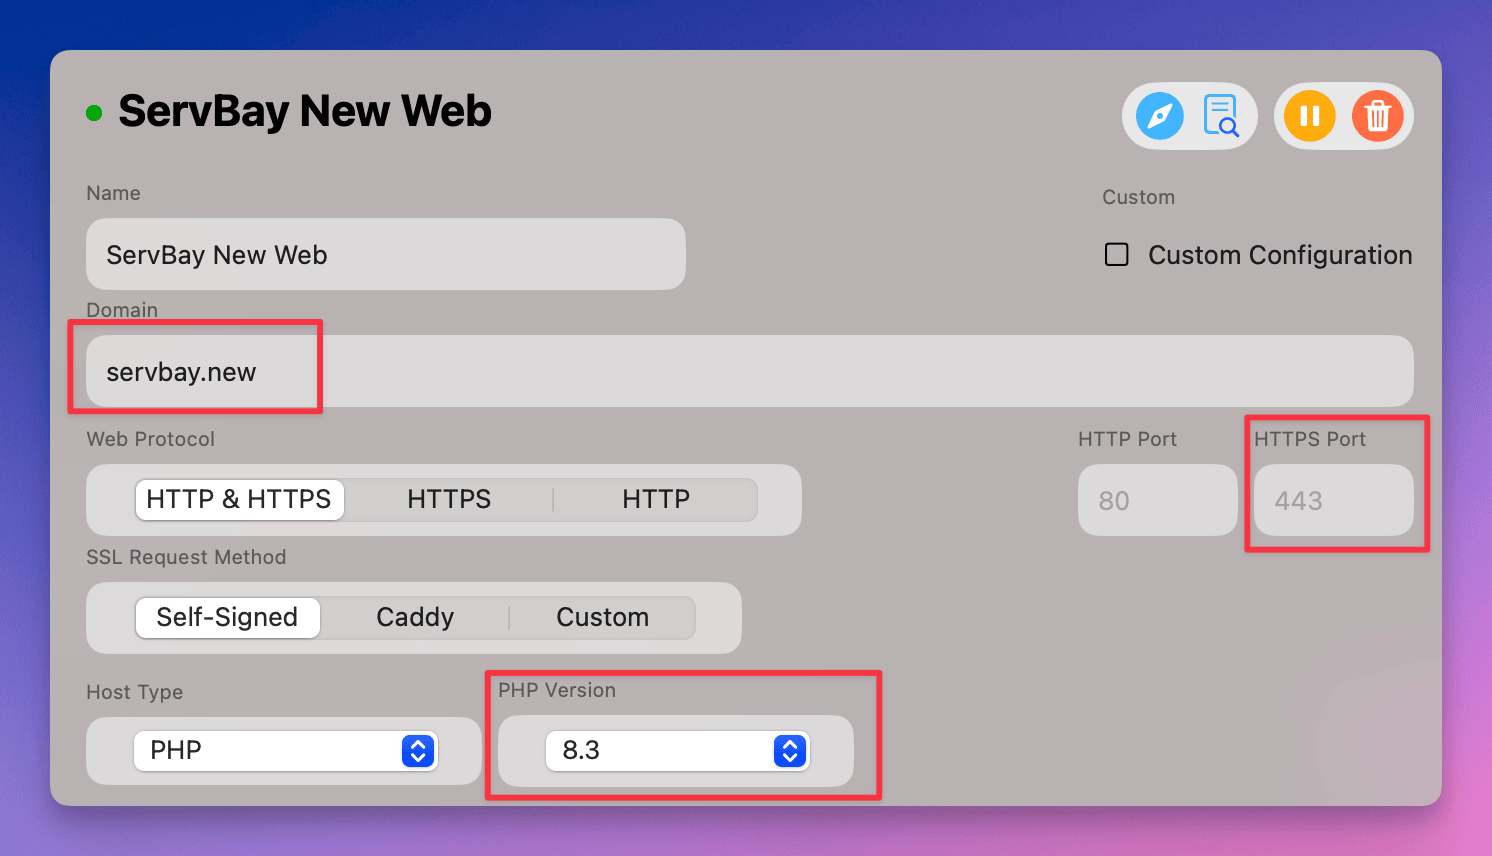 Ilustración: Configuración del puerto de escucha Xdebug en PHPStorm
- Dirígete a
Configura el mapeo de servidor web para PHP:
- Ve a
Languages & Frameworks->PHP->Servers. - Haz clic en el botón
+para añadir un nuevo servidor. - Ponle un nombre descriptivo (por ej.,
ServBay Localhost). - Establece
Hostcomo el dominio de tu web configurado en ServBay (por ejemplo,servbay.demo). - Define
Portsegún el puerto que utilices (usualmente443para HTTPS o80para HTTP). - Selecciona
DebuggercomoXdebug. - Marca
Use path mappings. - Define el mapeo entre la ruta local del proyecto (
Absolute path to local source) y la ruta en el servidor (Absolute path on the server). Por ejemplo, si el proyecto está en/Applications/ServBay/www/myprojecty accedes porhttps://servbay.demo/, la ruta local/Applications/ServBay/www/myprojectdebe mapearse a/en el servidor. Para dominios comohttps://myproject.servbay.demo/, la asignación también es de/Applications/ServBay/www/myprojecta/. - Haz clic en
OKpara guardar.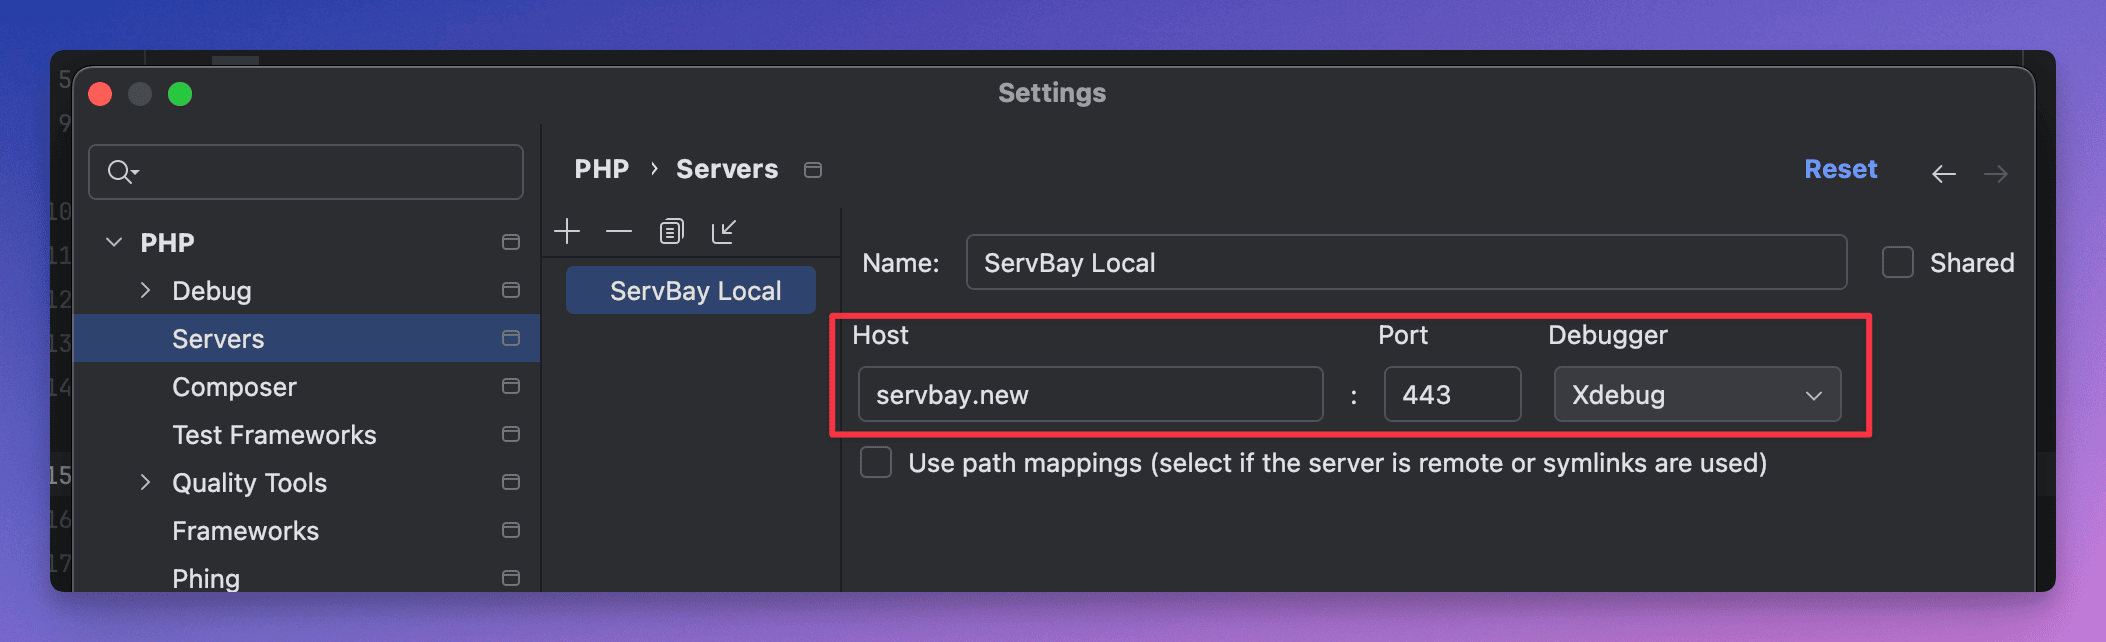
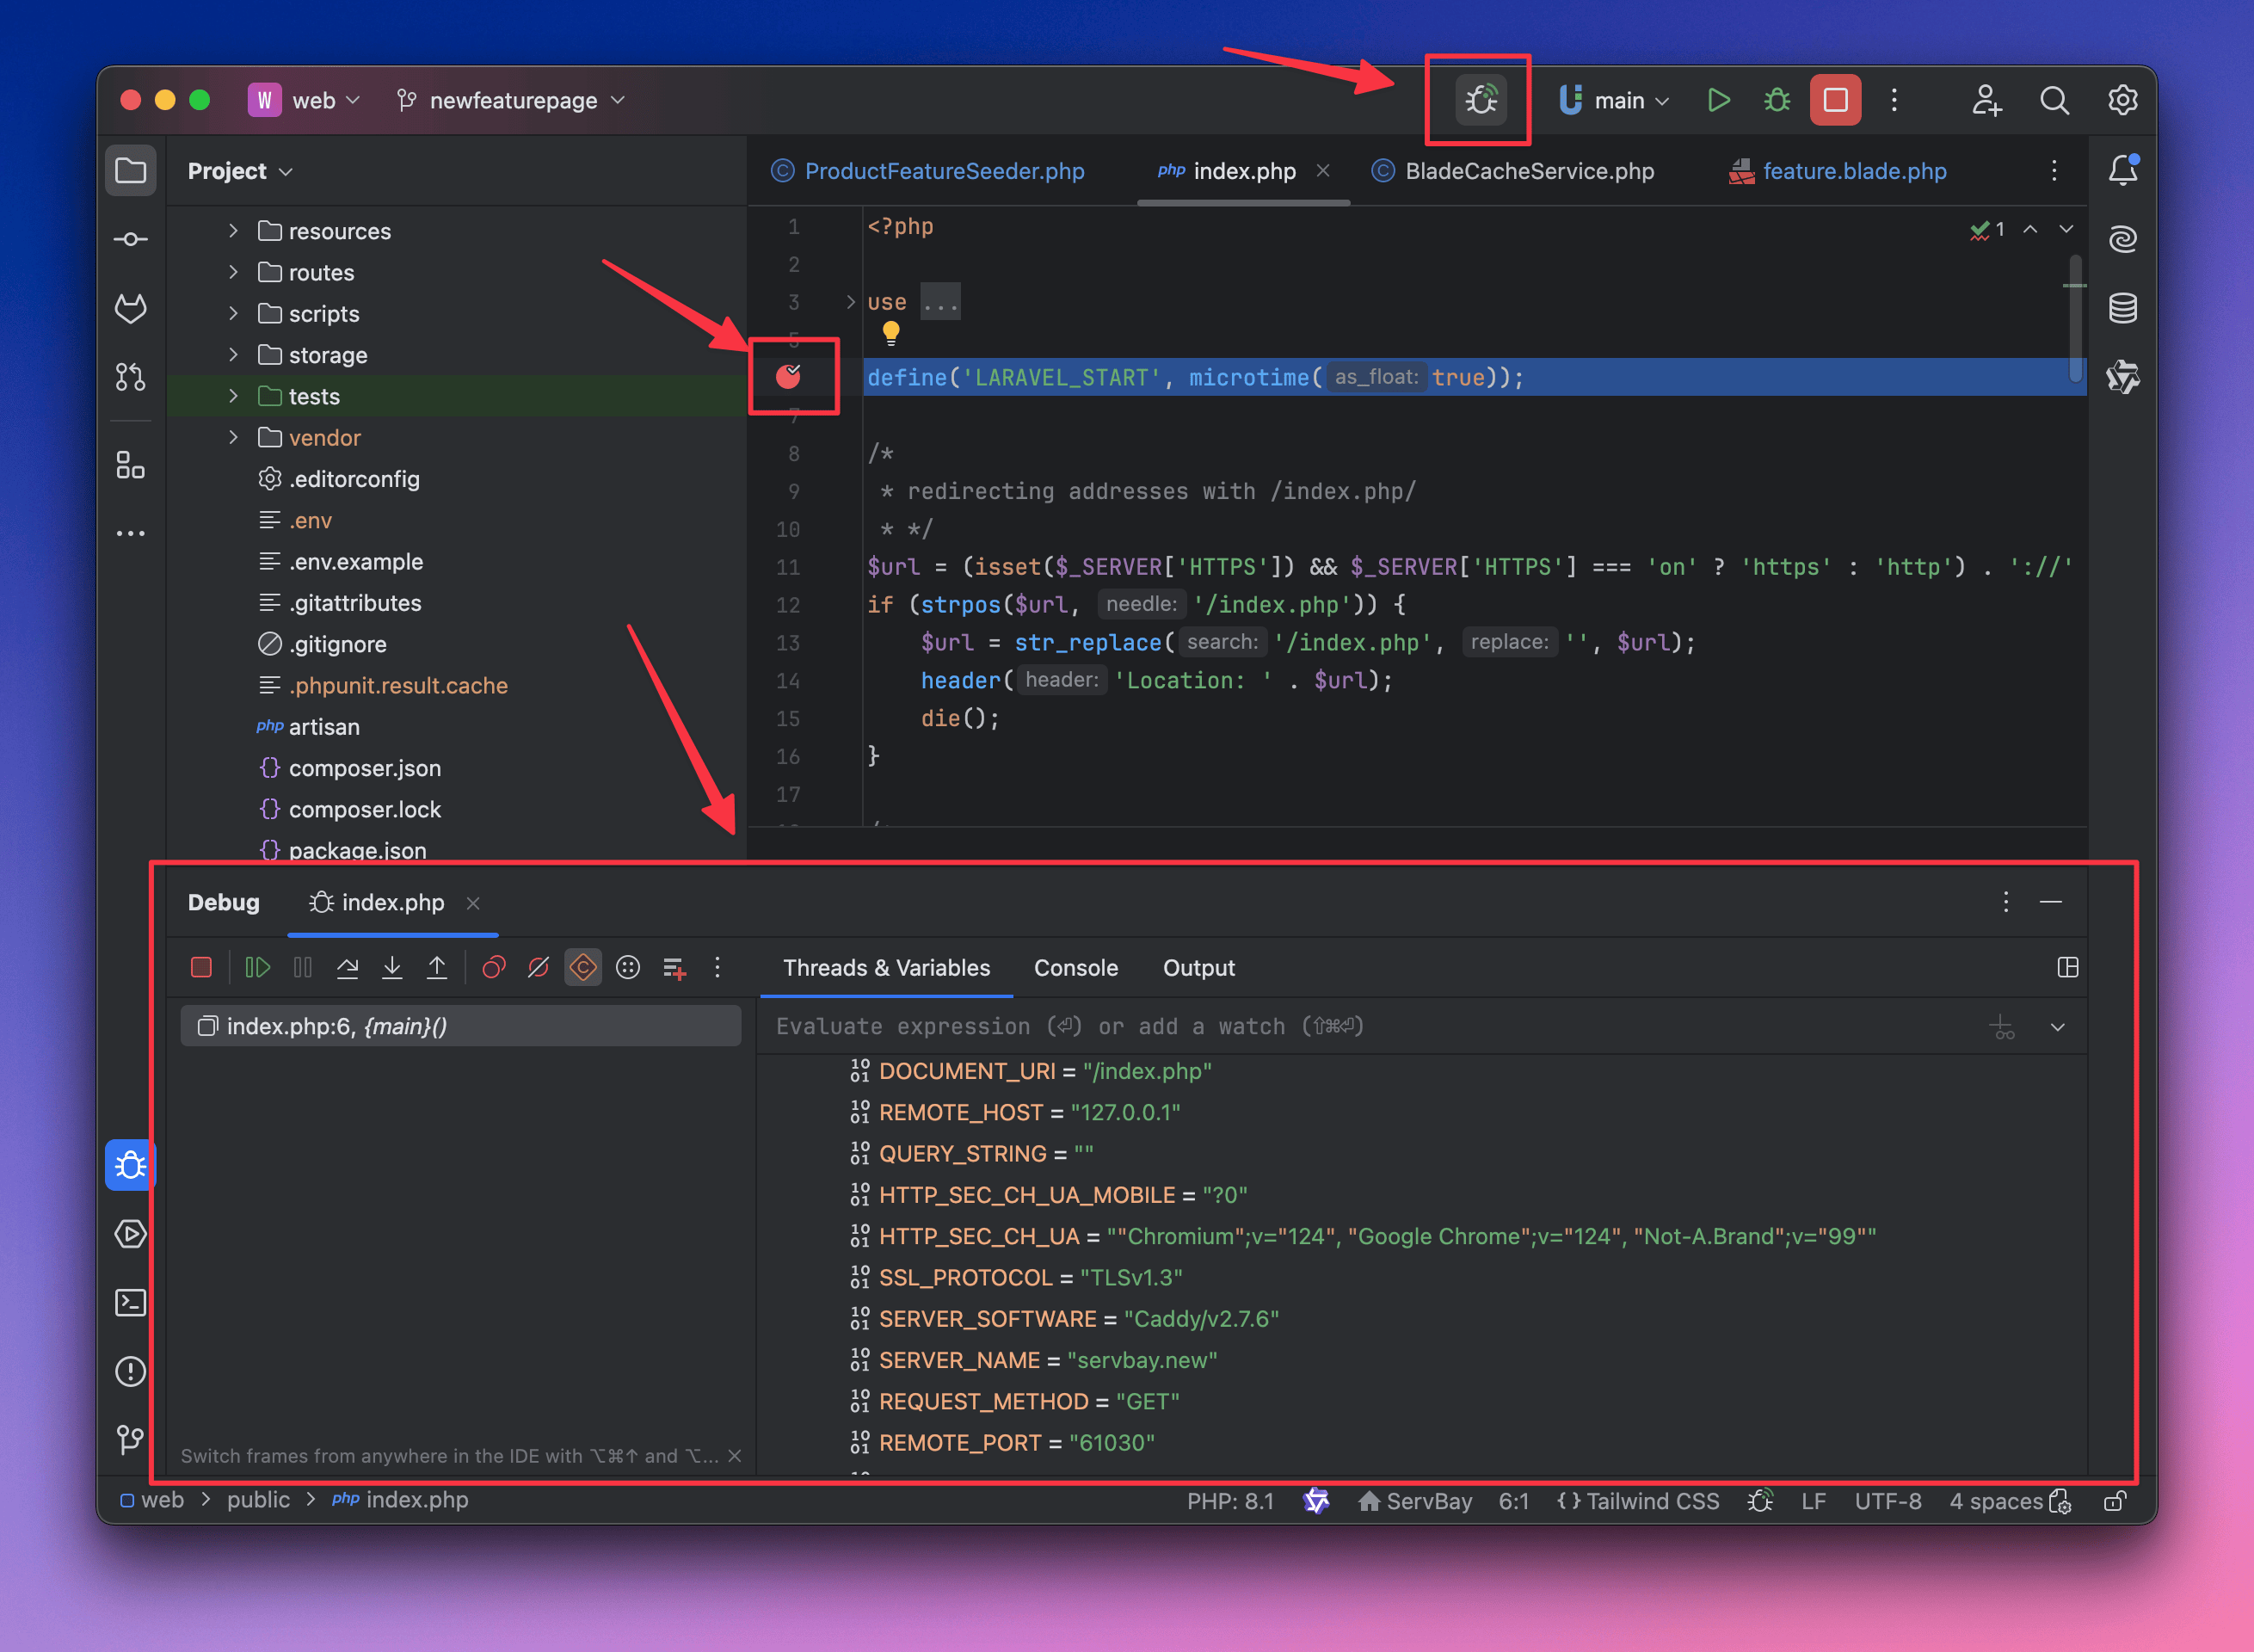 Ilustración: Configuración de servidores y mapeo de rutas en PHPStorm
- Ve a
Inicia una sesión de depuración:
- Abre el archivo del proyecto PHP que quieras depurar en PHPStorm.
- Haz clic en el margen izquierdo (junto al número de línea) para colocar un breakpoint (círculo rojo).
- Haz clic en
Iniciar escucha de conexiones PHP Debug(icono de insecto) en la barra superior de herramientas de PHPStorm. El icono se volverá verde, indicando que escucha conexiones Xdebug. - Accede a tu aplicación PHP desde el navegador (ejemplo:
https://servbay.demo/index.php). - Si todo está correctamente configurado, Xdebug se conectará a PHPStorm y detendrá la ejecución en el breakpoint definido, permitiendo la depuración desde el IDE.
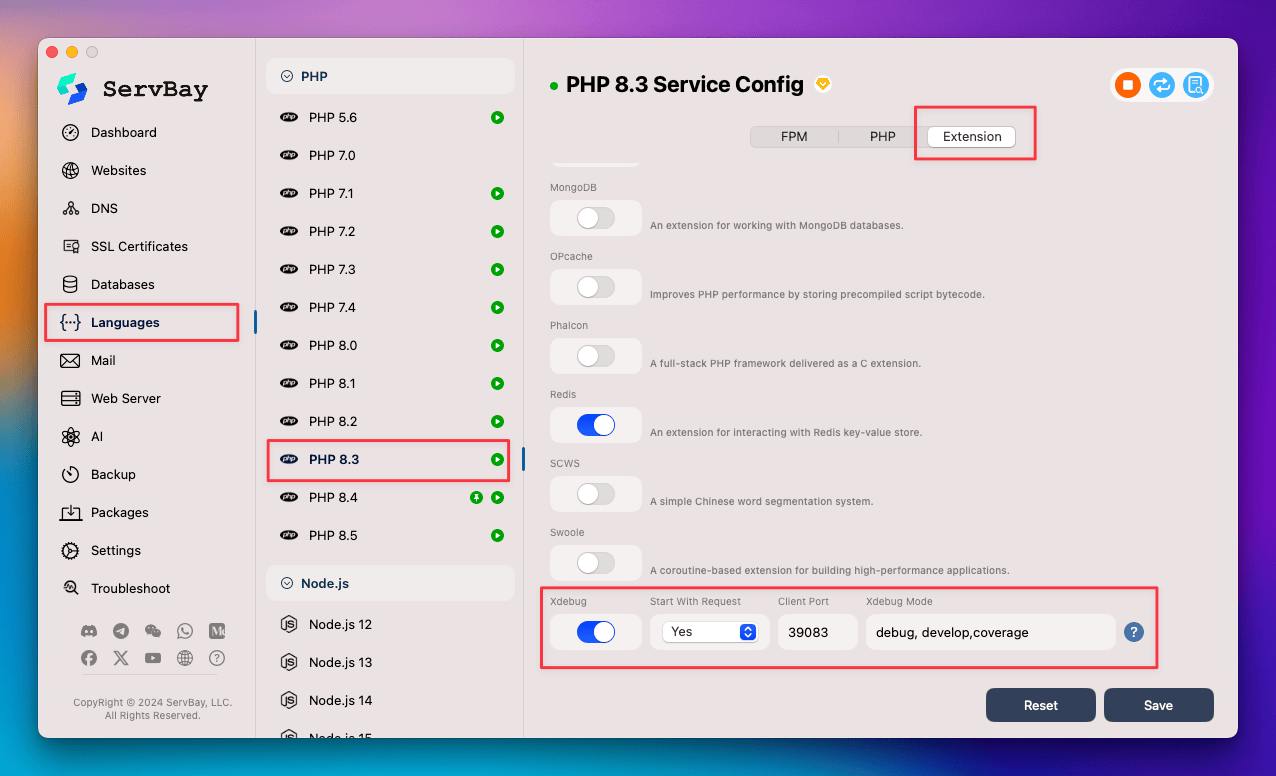 Ilustración: Iniciando la escucha de Xdebug en PHPStorm
Configuración de Xdebug en Visual Studio Code (VS Code)
VS Code también permite depuración con Xdebug instalando las extensiones adecuadas.
Instala la extensión PHP Debug:
- Abre VS Code.
- Ve a la vista de extensiones (
Ctrl+Shift+XoCmd+Shift+X). - Busca "PHP Debug" e instala la de Felix Becker.
Configura
launch.json:- Abre la carpeta de tu proyecto PHP.
- Cambia a la vista de ejecución y depuración (
Ctrl+Shift+DoCmd+Shift+D). - Haz clic en el icono de engranaje y elige "PHP". Esto generará un archivo
launch.jsonen la carpeta.vscodedel proyecto. - Edita
launch.jsonpara asegurarte de que el parámetroportcoincide con el puerto Xdebug configurado en ServBay para tu versión de PHP (ej.,39083para PHP 8.3). - Configura el mapeo de rutas (Path Mapping): Este paso es clave para la depuración en VS Code. En
launch.json, busca o añade la propiedadpathMappings, que asocia la ruta del proyecto en el servidor de ServBay al directorio correspondiente en tu sistema.jsonAjusta el valor de{ "version": "0.2.0", "configurations": [ { "name": "Listen for Xdebug", "type": "php", "request": "launch", "port": 39083, // Cambia este puerto según la versión de PHP usada "pathMappings": { // Mapea la ruta del proyecto en el root de tu web ServBay al sistema local // Ejemplo: si tu proyecto está en /Applications/ServBay/www/myproject // y accedes mediante https://servbay.demo/ entonces '/' corresponde a la raíz de tu proyecto local "/": "${workspaceRoot}" // Para proyectos accesibles vía subdominio como https://myproject.servbay.demo/ // igualmente '/' corresponde al directorio raíz local del proyecto // "/": "${workspaceRoot}" // También aplicable } }, { "name": "Launch currently open script", "type": "php", "request": "launch", "program": "${file}", "cwd": "${fileDirname}", "port": 39083 // Cambia este puerto según la versión de PHP usada } ] }pathMappingssegún la estructura de tu proyecto y configuración de ServBay.${workspaceRoot}se refiere normalmente a la carpeta principal del proyecto abierta en VS Code.
Inicia la sesión de depuración:
- Abre el archivo PHP en el que quieras poner un breakpoint.
- Coloca el breakpoint en el margen izquierdo (círculo rojo).
- Cambia a la vista de ejecución y depuración (
Ctrl+Shift+DoCmd+Shift+D). - Elige "Listen for Xdebug" en el menú de configuraciones de depuración.
- Pulsa el botón verde para iniciar la depuración. La barra de estado del VS Code se pondrá naranja, indicando que está escuchando conexiones Xdebug.
- Accede a tu aplicación PHP en el navegador. Si todo es correcto, Xdebug se conectará a VS Code y detendrá la ejecución en el breakpoint.
Preguntas frecuentes (FAQ)
P: ¿Xdebug no aparece en
phpinfo()?- R: Asegúrate de haber activado Xdebug desde la GUI de ServBay o editando manualmente el archivo
xdebug.ini. - Reinicia el servicio PHP correspondiente tras activar el módulo.
- Verifica que la ruta al archivo
xdebug.inies correcta y que la líneazend_extension = xdebug.sono está comentada. - Consulta los archivos de logs de ServBay (
/Applications/ServBay/logs/php/<version>/error.log) en busca de errores relacionados con la carga de Xdebug.
- R: Asegúrate de haber activado Xdebug desde la GUI de ServBay o editando manualmente el archivo
P: ¿El programa no se detiene en los breakpoints en el IDE?
- R: Comprueba que el IDE esté escuchando conexiones Xdebug (en PHPStorm el icono de insecto se pone verde, en VS Code la barra de estado se vuelve naranja).
- Verifica que el puerto configurado para Xdebug en el IDE coincida con el puerto establecido como
xdebug.client_porten ServBay para esa versión de PHP. - Revisa la configuración de path mapping; asegúrate de que las rutas de los ficheros en el servidor se correspondan exactamente con las rutas locales del proyecto, pues este es uno de los errores de configuración más comunes.
- Revisa la configuración del cortafuegos: asegúrate de que no bloquea la escucha del IDE en los puertos necesarios (por defecto los puertos
390xx). - Si has configurado
xdebug.start_with_request=triggerenxdebug.ini, asegúrate de usar un trigger (como el plugin Xdebug Helper en el navegador o añadiendo?XDEBUG_TRIGGER=1en la URL).
P: ¿Xdebug se desconecta después de un tiempo?
- R: Comprueba
xdebug.remote_autostartoxdebug.start_with_requestenxdebug.ini; si está enyespodría iniciarse en cada petición. Se recomienda el modotrigger. - Revisa las opciones de timeout de depuración en tu IDE, ya que ciertas configuraciones pueden provocar la desconexión.
- R: Comprueba
Conclusión
ServBay reduce al mínimo la dificultad de activar y utilizar Xdebug en entornos de desarrollo PHP, gracias a su integración de serie y a un proceso de configuración muy simplificado. Así, ya sea con su GUI intuitiva o editando archivos a mano, puedes habilitar Xdebug fácilmente para cualquier versión de PHP en ServBay. Combinando sus ventajas con las potentes funciones de depuración de PHPStorm, VS Code u otros IDEs modernos, podrás depurar, optimizar y garantizar la calidad del código PHP de forma mucho más eficiente. Dominar el uso conjunto de ServBay y Xdebug será una gran mejora para tu flujo de trabajo de desarrollo local en PHP.